Industry: Minerals

  • Global Trade is Moving On — Without the U.S.

    Global Trade is Moving On — Without the U.S.

    One way of looking at China’s trade economy in December and for the full 2025 year is its export surge, amplified by a weak currency, deflation at home, and inflation in most of the rest of the world. China pumped up total monthly exports 6.6% to $357.8 billion in December from $335.6 billion over the same period in 2024. 

    Here’s another angle: Washington’s efforts to crimp Beijing’s industrial sector have resulted in diminished U.S.-China trade, but even bigger Chinese surpluses with the rest of the world, and evolutions in global trade that are simply leaving America behind. For the full year, China exported $3.8 trillion worth of goods. Minus imports, that made for a total surplus of $1.19 trillion, the biggest in recorded economic history. 

    Chinese officials themselves have drawn direct links between U.S. policy and its surplus, saying in effect that without tariffs, Beijing would have bought more goods from the rest of the world. “Some countries have politicized economic and trade issues and restricted exports of high-tech products to China for various reasons; otherwise, we would have imported even more,” Wang Jun, a Chinese trade official, told reporters Wednesday. 

    According to the Petersen Institute for international economics, U.S. tariffs on Chinese exports average around 47%, while China’s average tariffs on US exports are around 32%.

    The Chinese export juggernaut needs markets like nature abhors a vacuum, and it’s found new landing places for its voluminous container ships. Exports to the European Union increased 11.5% in December to $51.9 billion. Exports to Germany increased 13% to $11 billion. By comparison, exports to the U.S. fell 30.2% to $34.2 billon. We are seeing the wheels of human economic history turn in real time. Global trade is still inching upward every year. The rest of the world is getting on with it, leaving the U.S. behind. While ports on the East and West coasts slow their activity, they’re busy in Asia, Europe, Latin America and Africa. Exports to ASEAN nations increased 11.3% to $66.4 billion, including a 20.4% jump to Vietnam to $18.9 billion; shipments to Latin America rose 9.8% to $25.7 billion; and sales to India increased 22.1% to $12.8 billion.  

    The story of global trade right now is geopolitics. It’s the jolt of the U.S. away from its post-war free trade consensus. There is another story we’ve discussed here that is less surprising but still ongoing. It’s the move of China and other Asian countries up the value chain, away from toys and shoes and into tech and cars. At the same time, countries like Egypt, Bangladesh and Cambodia continue to build up their apparel and textile exports. 

    In December, Chinese exports of high-tech products increased 16.7% to $93.7 billion. Sales of motor vehicles increased 73.2% to 994,000. By value, they rose 71.7% to $17.1 billion. Exports of toys fell 19.4% to $2.7 billion. Shipments of footwear dropped 17.4% to $3.9 billion. 

    On the import side, China ramped up purchases 5.7% to $243.6 billion from $230.5 billion. The relationship with the EU seems more two-sided than in the past. Imports from the EU rose 17.9% to $26.9 billion, while purchases from the U.S. plummeted 28.6% to $10.9 billion. Imports from Germany increased 13.6% to $8.9 billion. Imports from Latin America increased 26.8% to $24.4 billion. Imports from India rose 56.5% to $2.2 billion.

    Buying more from Europe and Latin America was also at the expense of some Asian neighbors. Imports from ASEAN countries fell 5.1% to $35.7 billion. Even imports from Vietnam were flat at $9.5 billion. 

    Imports of high-tech products rose 13.6% to $82.6 billion. Purchases of soybeans increased 4.7% to $3.9 billion. China still needs a protein supply, and it’s getting it from Brazil instead of the U.S.

    One sign the Chinese economy is doing just fine: China ramped up purchases of natural resources. It increased quantities of imports of iron ore by 6.5%, copper 7.3%, coal 11.9%, oil 17.4%, and natural gas 90.2%.

  • TDM’s Top 10 Trade Trends to Watch in 2026

    TDM’s Top 10 Trade Trends to Watch in 2026

    Happy New Year. While we wait on the Supreme Court to rule whether the Trump administration is entitled to apply tariffs on national security grounds, global trade grinds on. We at Trade Data Monitor are paying attention to what’s happening via the prism of official trade statistics. It’s a radically different world than when I started covering trade for the Wall Street Journal 20 years ago. The biggest story is still in tech, where the economy is being transformed by investment in chips and other electronics used to make artificial intelligence systems. Shut out of the U.S., many Chinese exporters are finding new markets in Europe. Beijing is not giving up its export-dependent growth model, which in 2025 propelled the world’s first-ever trillion-dollar trade surplus. Via our system for reverse engineering trade data, we can discern that Russia’s import demand is shrinking. Vietnam is still climbing the economic ladder, thanks to an export portfolio that includes staples like toys and shoes, but also high-value electronics. Most of the world has not given up on trade. In October, global container volumes increased 2.1%. However, the U.S. is an outlier. According to Bloomberg, the U.S. saw an 8% contraction in inbound shipments. Although President Trump threatened much higher levies, the U.S. effective tariff rate is “only” around 15%. That’s its highest level since the 1930s, and it’s the main reason the WTO is now forecasting 0.5% growth in global trade in 2026, instead of 1.8%.Here are our top trade trends to watch in 2026.
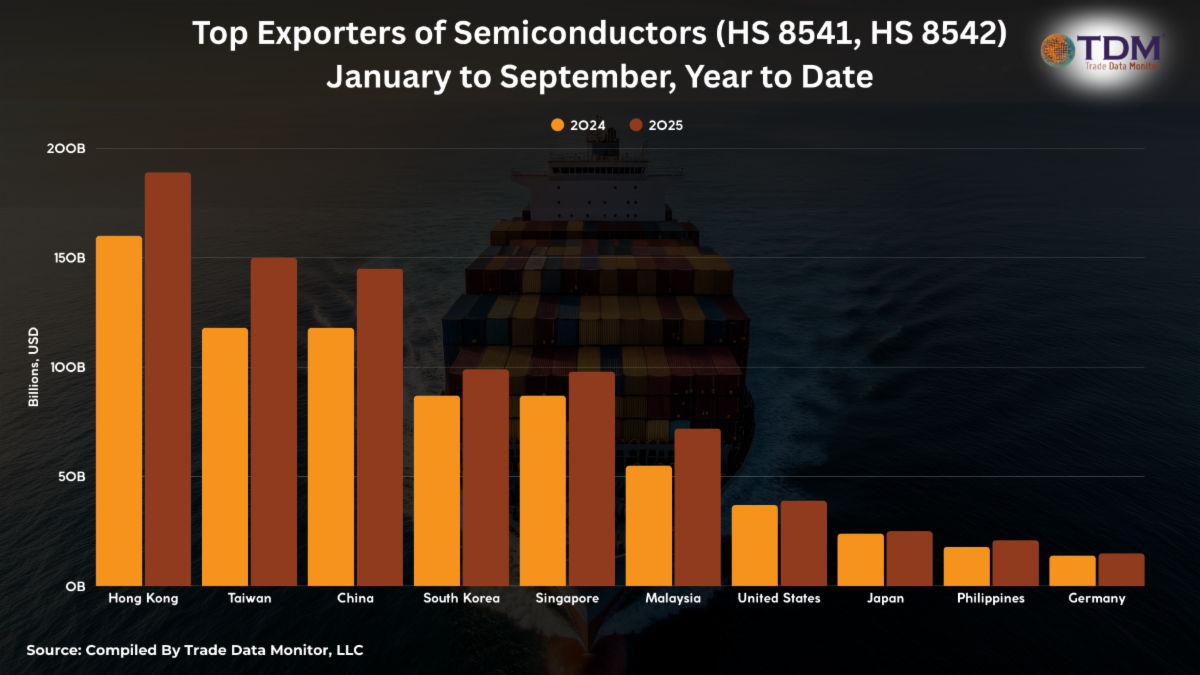
    1.   The Asian Chip MiracleThe chip market is expected to reach around $750 billion in 2026 and hit $2 trillion by the early 2030s. In its latest incarnation that trend is being led by Asia. Eight of the world’s top 10 exporters of chips, classified under HS8541 and HS8542 are Asian. Only the U.S. and Germany crack the top 10. 
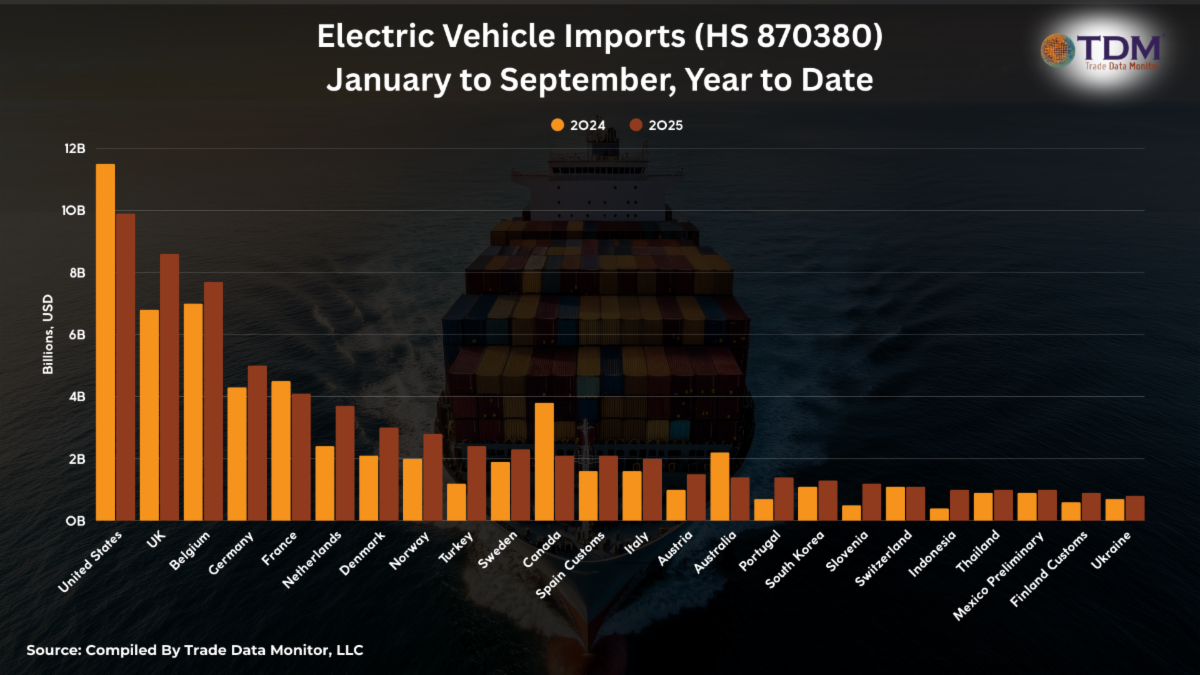
    Thanks in part to the chip industry, and parallel industries in batteries, engines and electronics, the electric vehicle industry is thriving. Slowly, the world’s road and filling stations are being rewired. In country after country, electric car imports have been increasing.  One consequence is booming trade in the critical minerals, like cobalt, manganese and nickel, needed to build electric cars and batteries. We’ll explore that trade in our February newsletter. 
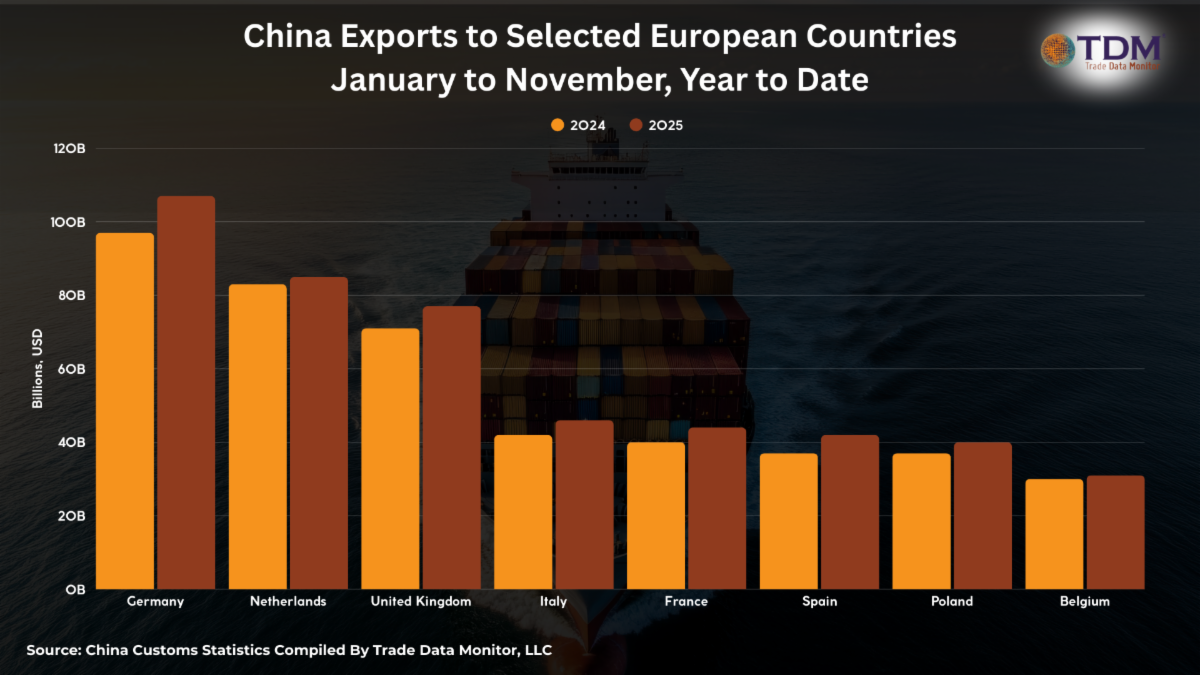
    2.   China Finding Markets in EuropeWith the U.S. throwing up roadblocks, Chinese exporters have been finding markets in Europe. That’s triggered a crisis for European domestic manufacturers, who are now having to compete with the China price Americans have turned down.
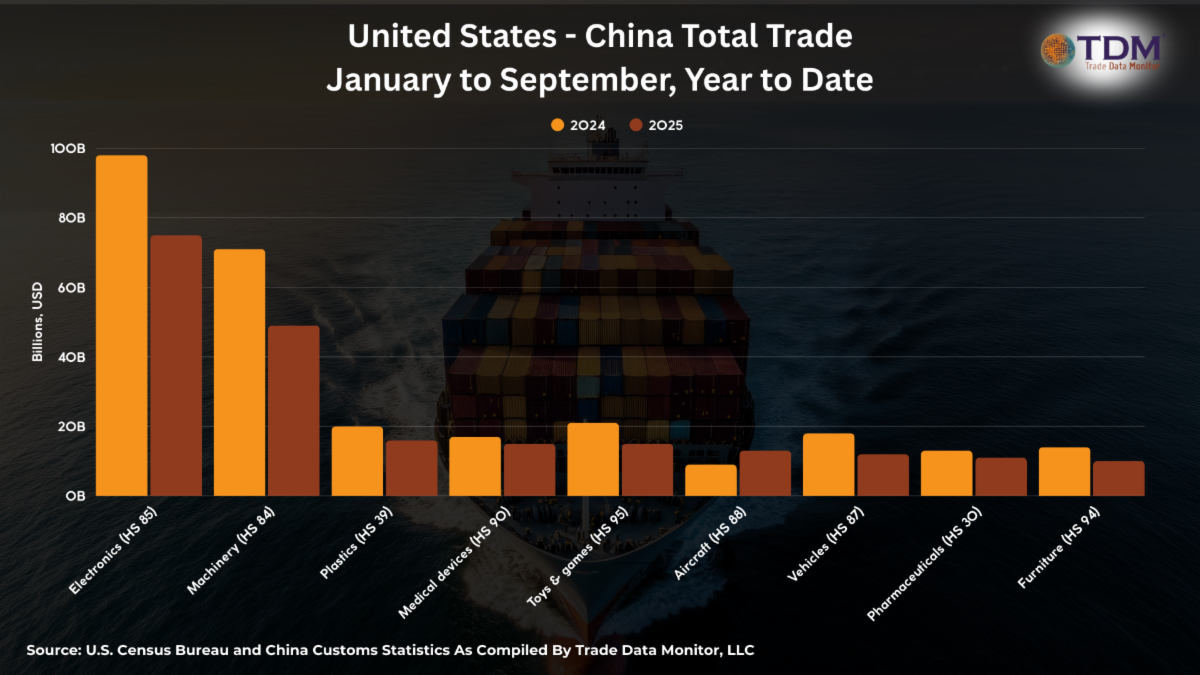
    3.   Where is U.S.-China Trade Headed?The future of the U.S.-China trade relationship seems uncertain at best. When we added up total trade between the two behemoths, the only sector has grew in 2025 was aircraft. The U.S. shipped $12.5 billion of aircraft and aircraft parts to China in the first nine months of 2025, up 45% from the same period in 2024.
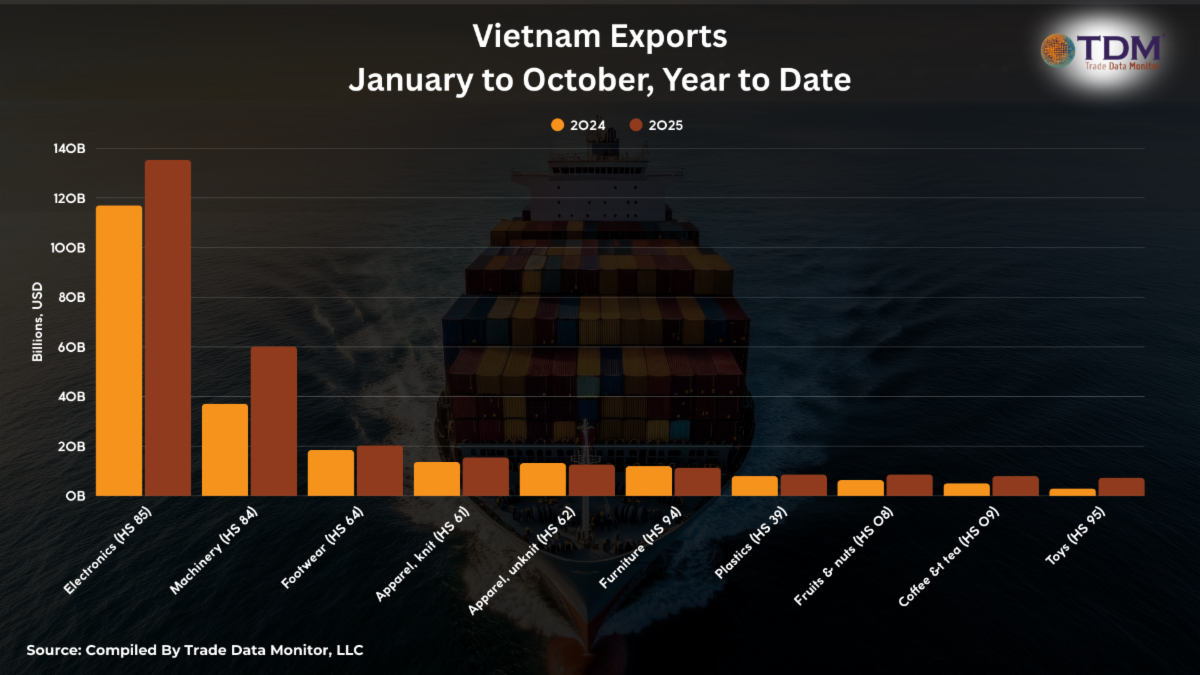
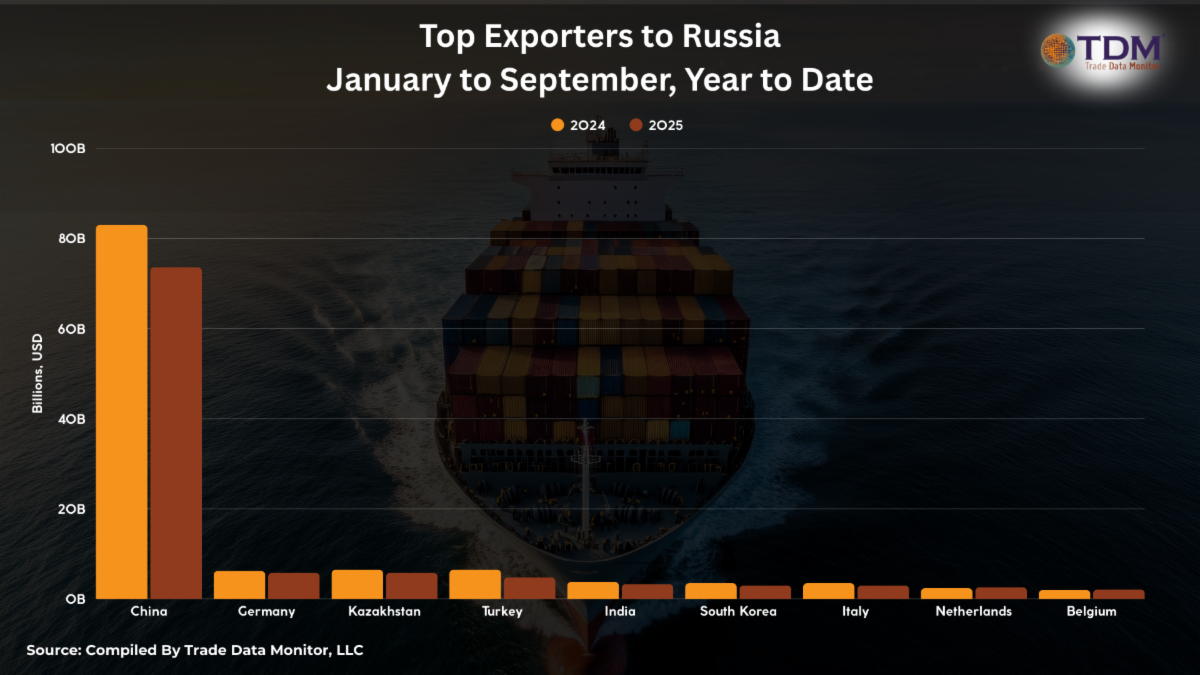
    4.   How Vietnam is Winning Global TradeAt TDM, we’ve been talking about Vietnam’s promise for a decade, so we’re not surprised to see its strong export numbers. The remarkable thing about Vietnam isn’t that it has become an export machine, it’s that its manufacturing capacity has increased across so broad a base. 5.   Russia’s Shrinking Import DemandRussia still isn’t publishing trade statistics, but thanks to the breadth of TDM’s database, we can look at which countries are shipping to Russia. Those exports to Russia are mostly shrinking, an indication of the battering Russia has been taking from the war. The IMF and other institutions predict Russian GDP growth of only around 1% in 2026. 
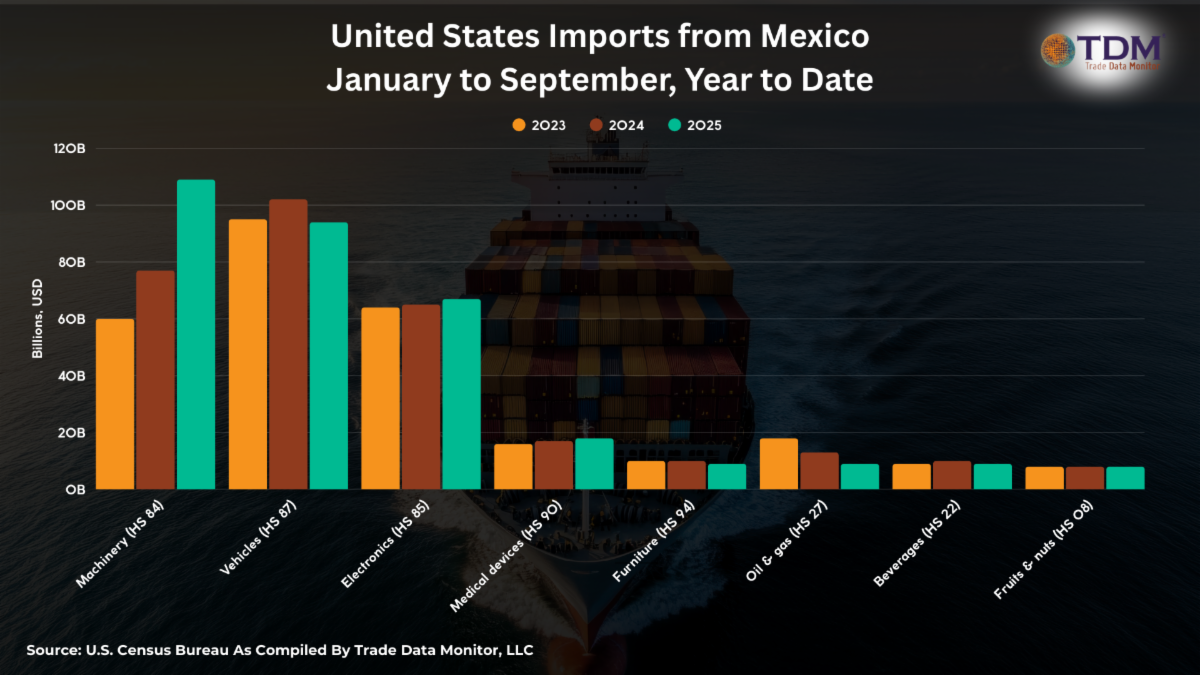
     6.   U.S. Imports from MexicoThe biggest beneficiary of the U.S.’s trade war with China has been Mexico. Although the two countries, and Canada, are now renegotiating the USMCA, businesses have had confidence they can manufacture in Mexico and ship north. Mexico has been suppressing data, but U.S. import statistics paint a picture.
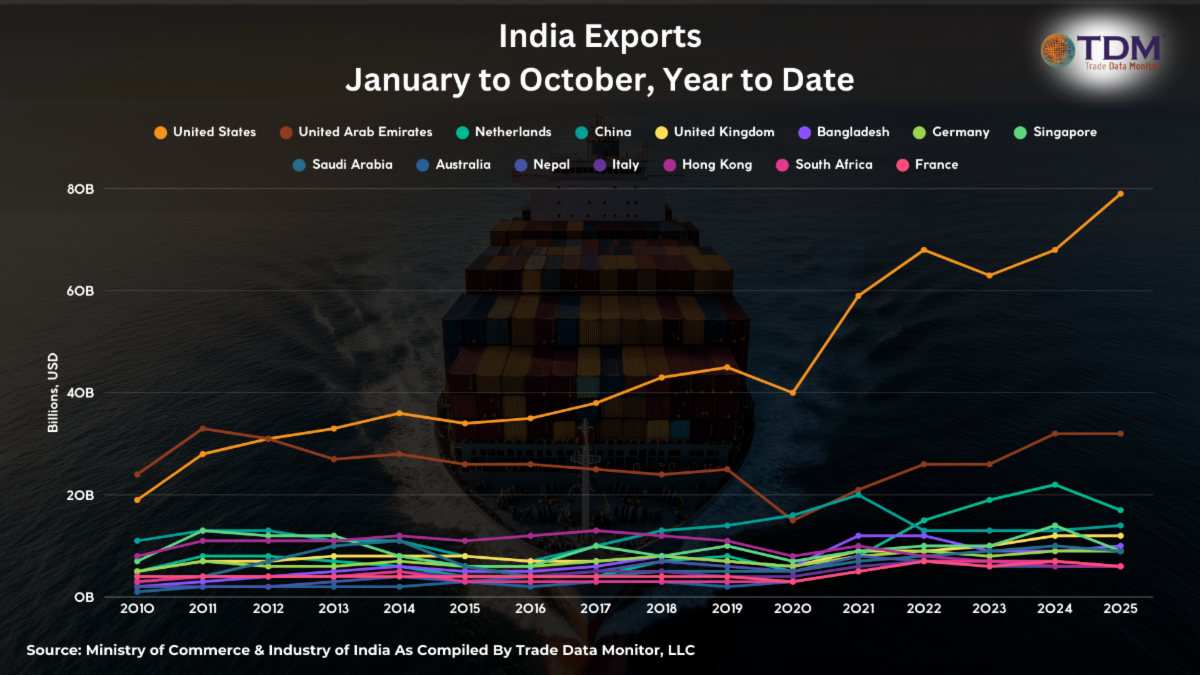
    7.   Indian ExportsNow with the world’s biggest population, India has now overtaken Japan as the world’s fourth biggest economy, behind the U.S., China and Germany. Its top market: the U.S., followed by UAE and the Netherlands. 
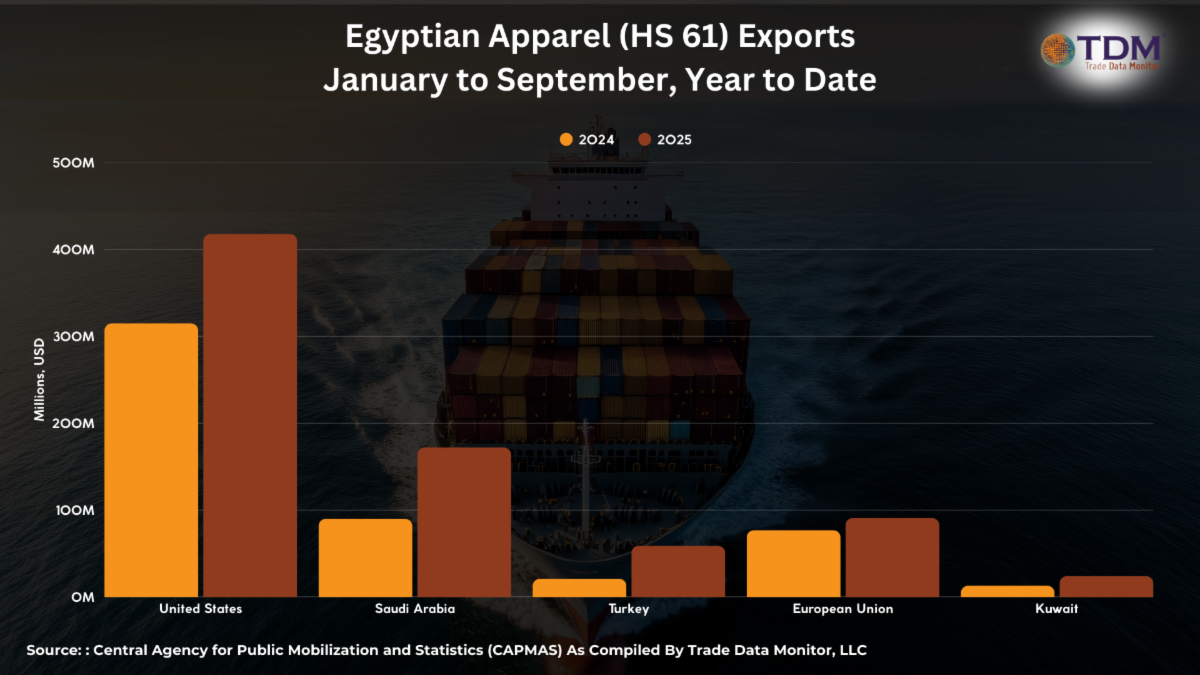
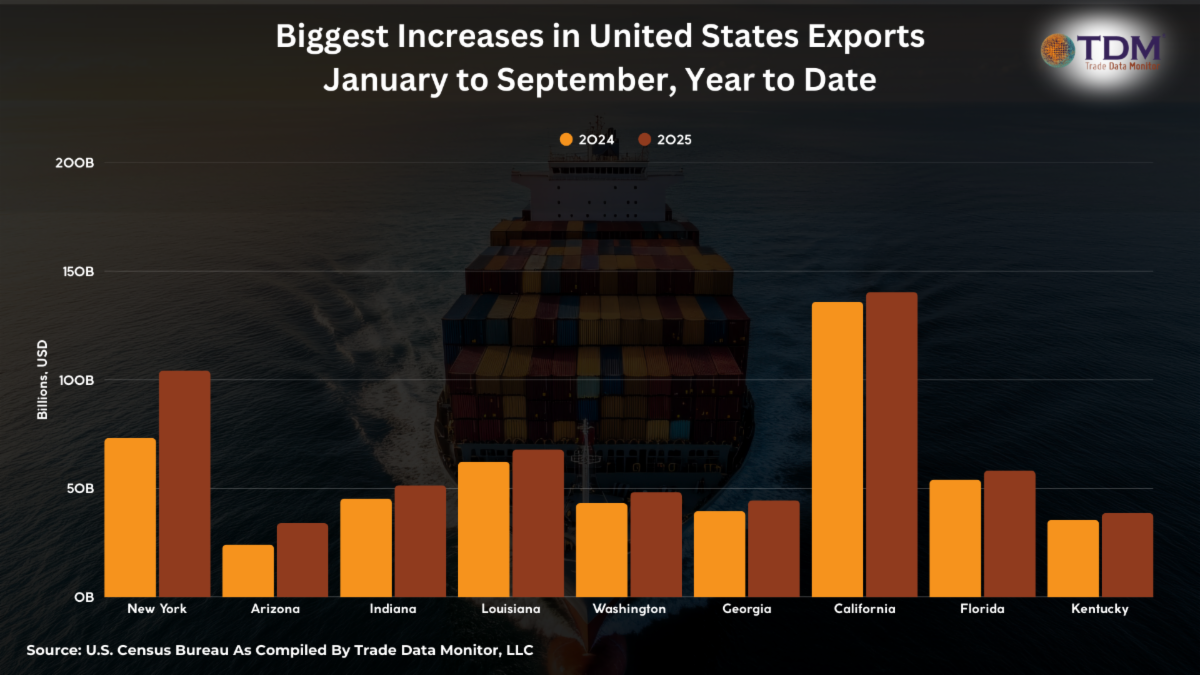
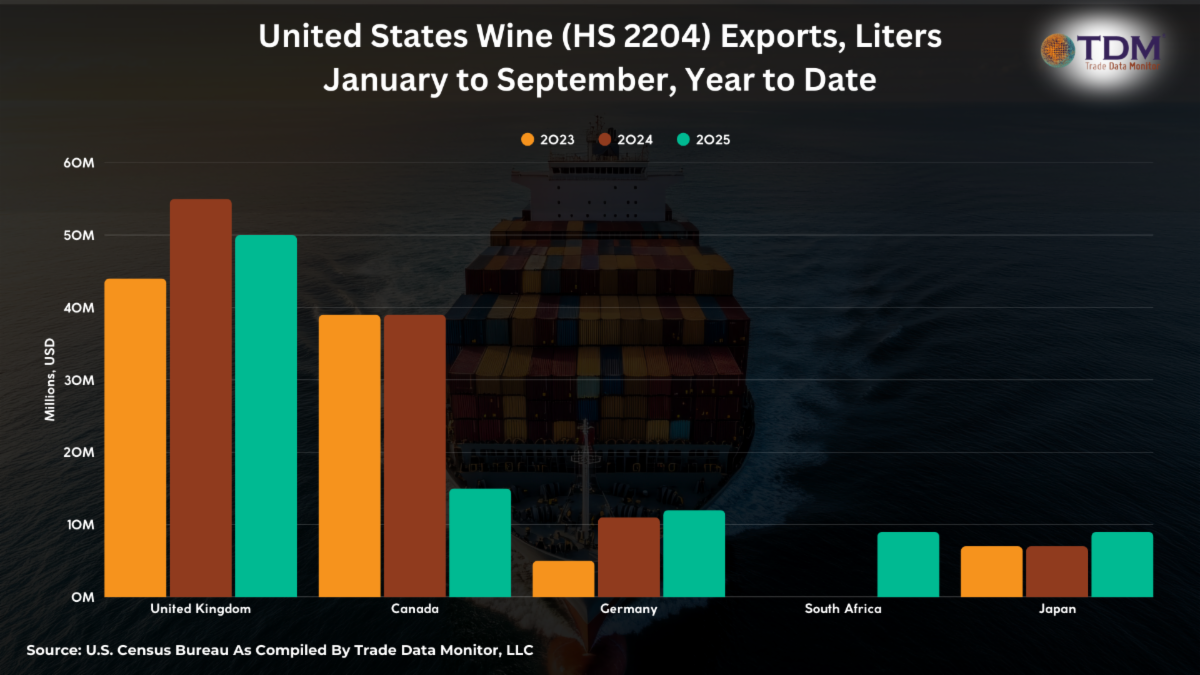
    8.   Trade Case Study: EgyptTrade coverage focuses on the big countries, but we’ve been studying smaller players, and one interesting case study is Egypt. It’s been boosting apparel exports, a sign of a country’s increasing prosperity and competitiveness on export markets. In 2025, Egypt clocked the biggest increase in apparel exports, shipping out $2.6 billion in the first nine months of 2025, 30.7% more than the year before. The second highest increase was registered by Cambodia at 16.9%, and no other country improved by double digits. 9.   What States’ Ports and Economies Are Thriving MostAmerica is a huge continental economy with dozens of distinct economic regions and sea- and airports. We sorted every state by increase year-on-year in exports from the place it’s leaving the U.S., over the first nine months of 2025. Texas and California are still the biggest exporters overall, but New York leads the race in year-on, because of its trade in physical gold. Arizona ranks second because of its electronics trade with Mexico. Third is Indiana, thanks to its exports of hormones to Italy. 10.   U.S. Wine ExportsA retaliatory tariff and a “Buy Canadian” movement have dented U.S. wine exports to its northern neighbor. Instead, U.S. producers are finding replacement markets in Germany, South Africa and Japan. 
    5 News Stories To Understand This Moment in Global Trade 📰
      
    WSJ: A Shrimper, a Carmaker, a Lawyer: How the World Tackled Trump’s Trade War: A fascinating mini-survey of how businesses around the world are being impacted by tariffs.Euronews: In 2025, global trade cracked as Europe hurt by US tariffs and new China shock: An important perspective, from Europe, on how trade flows have been rerouted toward the Old World. Global Trade: U.S. Tariffs to Cost Container Carriers $.2 billion by 2026, Alphaliner Warns: The U.S. isn’t just imposing tariffs on goods, it’s putting duties on ships. AP: Trump launched global tariff wars in 2025. Here’s a recap of his trade actions this year: A useful recap of U.S. trade duties in 2025. BBC: Peru’s ‘fast and furious’ blueberry boom: An optimistic story about global trade, chronicling how Peru has become the world’s biggest blueberry exporter.
    What We’re Reading 📚
      With tariffs still beating down optimism over global trade, it’s easy to get dragged down by the political story of modern commerce. What’s lost is the triumph of human ingenuity represented by the global logistics industry figuring out how to move goods from any place in the world to any other place. My former Wall Street Journalcolleague Christopher Mims tells that story in his 2021 book Arriving Today: From Factory to Front Door—Why Everything Has Changed About How and What We Buy. In an illustrative anecdote, Mims tells the story of a USB charger. After leaving a factory in Vietnam, Mims recounts, the charger “has traveled more than 14,000 miles, across 12 times zones, by truck, barge, crane, container ship, crane, and truck again, all before it trundled down a few hundred yards of conveyor, flitted about on the back of a robot, and was ferried again on, all told, miles more conveyor and at least two more trucks, before being hand-carried to someone’s front door.”

  • Is Global Trade Too Strong for Tariffs?

    Is Global Trade Too Strong for Tariffs?

    Global Trade Can Take a Punch

    This month, markets have swerved to adjust to the threat of new U.S. tariffs on Chinese imports. Yet, global trade keeps finding a way. In September, although shipments to the U.S. plummeted, China’s monthly exports increased 8.3% year-on-year to $328.6 billion.

    One way of looking at the stubborn performance of China’s export machine, and the global trading system, is that the swift emergence of an infrastructure that can function without the U.S.. “This resilience shows that China has strengthened trade with the rest of the world amid US protectionism,” ING Bank economist Lynn Song wrote in a published note Monday.

    To be sure, both China and the U.S have talked up the possibility of more radical constrictions on trade that would put more of a dent in the global economy, but so far this year, trade has been surprisingly robust. 

    The Supereconomies

    At the World Trade Organization’s forum last month, there was talk of how a multilateral trade deal might be conceived even if Washington didn’t join the party. But, despite new duties, even the U.S. is having a decent year trading with the rest of the world. In the first seven months of 2025, U.S. imports increased 11% to $2.1 trillion, while exports rose 4.6% to $1.2 trillion. 

    What’s going on here? 

    The simplest explanation is that the world’s two supereconomies are both so populated and wealthy that businesses can find opportunities to buy and sell despite governments’ new tax burdens. 

    To boot, China and the U.S. are less and less intertwined with each other, meaning that their trade dispute has less of an impact on the global economy that it would have a decade ago. 

    Ten years ago, in the first nine months of 2015, the U.S. accounted for 18%, or $303.8 billion, of China’s $1.7 trillion of exports. This year, in the first nine months of 2025, the U.S. was worth only 11.4%, or $317.2 billion, of China’s $2.8 trillion of exports. In September, exports to the U.S. dropped 27% to $34.3 billion. 

    The World is a Big Place

    To replace the U.S. markets, Chinese-based manufacturers, many of which are connected to U.S. and European corporations, have been finding substitute markets. In September, Exports to ASEAN countries increased 15.8% to $53.7 billion. Particularly, exports to Vietnam rose 24.6% to $16.7 billion. Exports to the European Union rose 14.2% to $48 billion. 

    One place that is becoming less valuable to Chinese exports: Russia, where exports dropped 21% to $8.9 billion.

    China’s economy has faced its own set of challenges, including a credit crisis and housing bubble. But in September, total imports increased 7.4% to $238.1 billion, despite imports from the U.S. falling 16.1% to $11.5 billion. Imports from the EU rose 9.5% to $25.2 billion, compensating for imports from ASEAN nations slipping 0.8% to $36.5 billion. 

    The Strength of Heavy Industry 

    The real reason for the boost in imports is an increase in purchases of industrial commodities. Imports of copper increased 6.4% to 2.6 million tons. Iron ore purchases rose 11.9% to 116.3 million tons. These came from commodity-rich nations in Africa and Latin America. Imports from Africa increased 22.5% to $10.6 billion, and purchases from Latin America rose 18.6% to $23.3 billion. China has been reducing its intake of fossil fuels. Coal imports in September fell 3.3% to 46 million tons. 

    All that metal is getting turned into a car industry that have overtaken the U.S. In September, automobile exports increased 10.8% to $12.8 billion. 

    In many cases, companies are overcoming protectionism for a simple reason: They can afford it. For example, in September, China’s exports of rare earths declined 4.3% by quantity, to 4,000.3 tons. By prices, they roughly doubled in value to $60 million. It’s often said that rare earths are essential for modern electronics, and that’s true, but the quantities required are miniscule, and even when supply gets tightened and prices spike, affordable.  

    There are real signs that tariffs and faltering consumer demand are denting exports of manufacturing staples. Exports of toys, for example, fell 28% to $2.9 billion. Sales of shoes fell 13.2% to $2.9 billion. Exports of household appliances dropped 9.6% to $7.7 billion. 

    One good sign for global trade: exports of ships increased 24% to 543 from 438. By value, sales rose 43% to $6.6 billion. Ships are becoming more valuable because firms need them.

  • Casualties of the U.S.-China Trade War: 36 Million Phones

    Casualties of the U.S.-China Trade War: 36 Million Phones

    Please Dial a New Number 

    As U.S. and Chinese negotiators try to find a way out of tariff gridlock, one thing is certain: The smartphone supply chain has shifted significantly, upending the practices and expectations of manufacturers, logistics firms, and retailers.  

    China’s exports of mobile phone fell 11.6% year-on-year in August to 60.8 million sets. In dollar terms, they declined 18.9% to $6.8 billion. For the first eight months of 2025, Chinese exports of mobile phones dropped 11.5% to $64.1 billion. The number of sets shipped shrank 7.2% to 462.5 million. 

    That’s 36 million fewer phones. 

    It’s no mystery where the capacity has shifted. In the first seven months of 2025, the U.S. has boosted smartphone imports 201.7% from India to $13.2 billion, and 170.9% from Vietnam to $3.5 billion. 

    Chinese Export Growth Slows

    Overall, total Chinese exports rose 4.4% in August to $321.8 billion, below a forecast around 5% and after increasing 7.2% in July. Shipments to the U.S. fell 33.1% to $31.6 billion. Washington currently has tariffs of around 55% on most Chinese exports, while Beijing has duties of around 30% on U.S. goods. Trade diplomats from each country have given themselves two more months to negotiate. 

    Meanwhile, China has been increasing exports elsewhere. Exports to the European Union rose 10.4% in August to $51.7 billion. Shipments to ASEAN nations rose 22.8% to $57.1 billion. Exports to Vietnam increased 31.2% to $17.6 billion. Sales to Africa increased 26% to $18.6 billion. Shipments to India increased 9.2% to $12.5 billion. 

    To be sure, there’s only so much more those countries can absorb, and analysts expect exports to level off. “With the temporary boost from the U.S.-China trade truce fading and the U.S. raising tariffs on shipments rerouted via other countries, exports are likely to come under pressure in the near term,” Zichun Huang, China of Capital Economics wrote in a note. The U.S. has been concerned about transshipment and is implementing penalties for goods it believes originate in China.

    One country already buying less from China is Russia. Chinese exports to the warring nation fell 16.6% to $8.5 billion. So far this year, exports to Russia have fallen 9.7% to $64.8 billion. 

    Buying More Soybeans

    The U.S. has been pushing China to buy more soybeans. In August, soybean imports increased 1.1% by quantity to 12.3 million tons, but fell 8.6% by value to $5.5 billion. Imports of agricultural products declined 2.9% in August to $18.7 billion. Grain exports increased 7.1% to 217,816 tons but because of falling prices fell 11% by dollar value to $102 million. Overall, exports of agricultural products fell 3.8% to $8.1 billion.

    Rare Earth Exports Rise 

    Washington has also been lobbying for easier trade in rare earths minerals. Exports of rare earths increased 34.6% in August to $55 million. By quantity, they increased 22.6% to 5.791.8 tons. Exports of high-tech products increased 9% to $79.3 billion. Sales of China’s manufacturing staples continued their long, slow fall. Exports of footwear declined 17.1% to $3.3 billion, sales of toys fell 20.9% to $3.2 billion, and shipments of household appliances dropped 6.6% to $8.4 billion. 

    China’s Long-Term Cut in Imports

    Total Chinese imports increased 1.3% to $219.5 billion, as the country stabilizes as more of a self-sustaining market. Imports were down 6% from $233.4 billion in August 2022. In the first seven months of 2025, China reduced imports 2.2% to $1.7 trillion. 

    China is buying less from all its trading partners. In August, imports from the European Union fell 1.8% to $22.8 billion, purchases from the U.S. declined 15.8% to $11.3 billion, and shipments from ASEAN countries fell 3.8% to $32.8 billion. Imports from Africa declined 6.9% to $9.6 billion. Imports from Russia dropped 18.7% to $9.4 billion. 

    There were some exceptions: Imports from Vietnam rose 4.6% to $8.9 billion, and purchases from India rose 16.2% to $1.5 billion, a relatively small number. Imports of high-tech products rose 3.5% to $67.3 billion. 

    To be sure, even as it buys more of what it produces, China still needs raw materials. Imports of copper ore and concentrates increased 7.4% to 2.8 million tons. However, China continued to cut its coal imports: Purchases of the black rock dropped 6.7% to 42.7 million tons.

  • China Ramps Up Exports to Vietnam Amid Transshipment Worries

    China Ramps Up Exports to Vietnam Amid Transshipment Worries

    Made in Vietnam (or China)

    At a time when trade officials around the world are closely watching Vietnam’s evolving place in the global trading system, Chinese exports to the new Asian economic power in June boomed 23.8% year-on-year to $16.3 billion.

    The U.S.-China trade war has pushed attention of U.S. trade negotiators toward manufacturing powers such as Vietnam, Singapore and Malaysia. 

    Vietnam has had a trade deal with the U.S. for over 20 years. The country is now the U.S.’s sixth biggest source of imports, after Mexico, Canada, China, Ireland, and Switzerland. Vietnam is actually the fifth biggest source if you take away gold shipments from Switzerland. 

    Earlier this month, President Trump announced a new trade deal with Vietnam that includes 20% tariffs on U.S. imports from the Asian country. With one exception: 40% tariffs on imports from Vietnam that are “transshipped” from China. That set off an effort by Vietnamese trade officials to certify which goods made in their country are in fact domestic and not repackaged Chinese fare. 

    With shipments from China increasing so fast, they’ll have their work cut out for them, especially as the economic relationship appears to be growing more one-sided: China’s imports from Vietnam in June shrank 13.4% year-on-year to $7.6 billion. 

    China’s Resilient Export Economy

    The pressure of the trade war with the U.S. shows no signs of abating. Chinese negotiators now face an August 12 deadline to set new trade terms with the U.S.

    Overall, Chinese exports in June rose 5.8% year-on-year to $325.2 billion. Beijing is successfully weathering the storm: Current duties on Chinese imports vary by product but are at an average of around 55%, according to a recent social media post by President Trump. 

    Exports to the U.S. fell 16.1% to $38.2 billion. However, that decline was lower than the fall in May, and it’s been counterbalanced by an increase in sales to other countries. 

    The rebound in trade with Europe appears significant. Exports to the European Union rose 7.6% to $49.2 billion. Shipments to Germany increased 3.6% to $10.1 billion. Exports to Italy and France both rose by double-digit figures. European countries stand to benefit from the loss of export markets in the U.S. Buyers there can snap up excess production that can’t find a home in the U.S., and benefit from lower prices.

    Exports to Africa leapt 34.9% to $19.6 billion. Exports to ASEAN countries improved 17% to $58.2 billion. Exports to Brazil fell 8% to $6.1 billion. 

    The Russia Relationship

    After Russia invaded Ukraine in 2022, Beijing and Moscow forged a close trade relationship, but that appears to be crumbling. Russia shipped raw materials to China, and bought electronics, especially for the war effort. But in June, exports to Russia declined 16.2% year-on-year to $8.3 billion. Imports from Russia fell 11.2% to $9.3 billion. To be sure, a big part of the decline can be attributed to the struggles of Russia’s economy.

    Cars, Not Phones

    China’s main casualty of the trade war might be smartphones. Exports of mobile phones fell 8.8% to $7.4 billion. However, overall exports of high-tech products rose 7.3% to $78.1 billion. The Chinese export economy appears increasingly geared toward high-tech industrial goods, especially cars. Exports of motor vehicles increased 23% to $10.8 billion. Exports of ships leapt 23.7% to $4.5 billion. Shipments of agricultural products declined 6.2% to $8.1 billion. Exports of suitcases, textiles and footwear all continued their decline.   

    The Chinese Economy 

    Concerns remain about Chinese demand and the country’s domestic economy. In June, total imports increased only 1% year-on-year to $210.4 billion. 

    Imports from the U.S. fell 14.8% to $11.6 billion. Imports from the EU, however, notched up 0.6% to $23.3 billion, another sign of Brussels taking a different tack toward China than Washington. Imports of agricultural products increased 2% to $18.5 billon. Imports of high-tech products increased 10% to $67.7 billion. Imports of integrated circuits rose 11.6% to $34.6 billion. Although purchases of crude petroleum and natural gas increased, imports of coal fell 25.8% to 33 million tons. 

    And, despite the success so far in withstanding pressure from the U.S., the Chinese economy will keep taking punches from the trade war. “Tariffs are likely to remain high and Chinese manufacturers face growing constraints on their ability to rapidly expand global market share by slashing prices,” wrote Capital Economics in a note. “We therefore expect export growth to slow over the coming quarters, weighing on economic growth.” 

  • 50 U.S. States Have 50 Trade Economies

    50 U.S. States Have 50 Trade Economies

    The politics of trade in the U.S. have gotten complicated during this century, mainly because deindustrialization in the Rust Belt has cost so many factories and jobs. The free trade consensus of the 1990s that led to NAFTA and China joining the World Trade Organization in 2001 is dead.

     But it shouldn’t be lost on observers of the U.S. economy, or political and business leaders, that the U.S. is still a trade power. Its trade terms are friendly to businesses of all kinds. The U.S. is the world’s top importer, and the number two exporter, behind only China.

    When one breaks down U.S. trade by state, as Trade Data Monitor easily permits in its user-friendly interface, one can see that there’s a new profile for the U.S. trade economy. The top sectors for exports are now electronics, centered around California’s trade with Asia, oil and gas out of Texas and Louisiana, and agriculture, including trade out of Illinois. There are, of course, hundreds of other niche sectors doing well in global markets.

    The top overall exporter is Texas, which shipped out $266.3 billion of goods in the first seven months of 2024, followed by California ($104 billion), New York ($56.1 billion), Louisiana ($49.9 billion, and Illinois ($47 billion.) Texas’s top exports were oil and gas ($128.7 million), electronics ($28.6 million), industrial equipment ($26.1 million), and plastics ($13.7 million). By country, the top destinations for Texas’ exports were Mexico ($72.7 billion), Canada ($22.2 billion), the Netherlands ($18.2 billion), and South Korea ($14.4 billion).

    It’s important to remember that the U.S. has never been a trade monolith. In fact, different trade outcomes in different parts of the country have resulted in political conflict since the beginning of the republic. In the 19th century, for example, Northern industrialists wanted import tariffs to protect their factories. Southern farmers reliant on exports of crops like cotton produced by enslaved labor wanted lower tariffs to keep foreign markets open. In the postindustrial era, the biggest exporters are no longer manufacturing economies like Ohio and Michigan but states with gas and oil fields or big agriculture.

    The most diverse trade economy is California’s, partly because of the state’s ports in Long Beach and Los Angeles. California’s top exports in the first seven months of 2024 were industrial machinery ($18.3 billion), electronics ($17.6 billion), optical and medical devices ($11.6 billion), edible fruits and nuts ($6.5 billion), and aircraft and parts ($4.6 billion). California’s top destinations were Mexico ($19 billion), Canada ($11.1 billion), China ($8.8 billion), Japan ($6 billion), and Taiwan ($5.5 billion).

    California’s been leading the charge in shipping food and agriculture. The top food and ag exporters in the first seven months were California ($12.6 billion), Louisiana ($10.4 billion), Washington ($10.1 billion), Texas ($5.6 billion), and Illinois ($4.5 billion).

    The fifth biggest exporter was Illinois, partly because of its role as a logistics hub centered in and around Chicago. Its top exports were industrial machinery ($8.4 billion), electrical machinery and equipment ($5.5 billion), vehicles ($4.6 billion), food and agriculture ($4.5 billion), and pharmaceuticals ($2.8 billion).  

    On the import side, the top U.S. importers by state in the first seven months of 2024 were California ($275.7 billion), Texas ($229.1 billion), Illinois ($122.1 billion), Michigan ($102.5 billion), and New Jersey ($89.1 billion). California’s top imports were electrical machinery ($59.1 billion), industrial machinery ($52.6 billion), vehicles ($30.2 billion), and gas and oil ($19.7 billion).

  • China Hikes Metal Exports Amid Record Surplus

    China Hikes Metal Exports Amid Record Surplus

    As the business world girds for a fresh wave of trade protectionism and the possibility of a second Trump administration, China bumped up exports of two essential metals. In June, its shipments of steel products increased 20.8% year-on-year by quantity to 8.7 million tons and 3.8% by value to $6.8 billion. Its shipments of unwrought aluminum and aluminum products rose 23.8% by quantity to 609.5 thousand tons and 25.2% by value to $2 billion. 

    Overall, China increased total exports 8.6% to $307.9 billion. Total imports fell 2.3% to $208.8 billion, setting a new record $99.1 billion surplus. That’s unlikely to quelch fears about Chinese factories flooding global markets. The U.S. has had tariffs on Chinese steel and aluminum since 2018, and recently announced new tariffs on Chinese metal transshipped through Mexico. The European Union is imposing new provisional duties on Chinese electric vehicles, a crucial export. 

    The current Chinese export boom seems geared toward industrial products instead of consumer goods, and that’s likely what protectionism will focus on. Chinese exports of petroleum products rose 26.7% to $3.9 billion, and increased 19% by quantity to 5.4 million tons. Exports of high-tech products rose 6.8% to $73 billion. Exports of agricultural commodities increased 10.3% to $8.7 billion. However, exports of grain, rare earths, ceramic products, and fertilizers, along with toys, garments and toys, all fell. 

    Around the world, more countries are now imposing tariffs on Chinese exports. Turkey is also pondering a tax on EVs. The Chinese car industry, especially its EV sector, has become the talk of the global economy. Exports of motor vehicles increased 12.6% in June to $8.7 billion. Indonesia is planning a 200% duty on textiles, while India is studying imports of Chinese steel. 

    But as the U.S. example over the last decade shows, tariffs don’t always keep out exports. Shipments to the U.S. in June rose 7.5% to $45.5 billon. Sales to ASEAN countries increased 16.5% to $49.8 billon. Exports to the EU rose 4.3% to $45.7 billion. “Tariffs from the US and EU won’t significantly impact overall exports in the short run. They only target a small portion of Chinese exports,” said Zichun Huang of Capital Economics. Tariffs can be avoided, he wrote, via “trade rerouting and exchange rate adjustments.”

    Next week, China’s leadership will meet to review its economy and strategic plan. Beijing has tried to diversify its trade profile by expanding its network outside the traditional markets of the U.S. and EU. Exports to Africa in June dropped 2.8% to $14.5 billion, while imports from the continent rose 23.9% to $9.9 billion. Exports to Latin America rose 16.3% in June to $25.4 billion. Imports from Latin America declined 2.5% to $19.5 billion. 

    One important trade relationship for China’s leaders to consider, because it’s so perplexingly small is that with India. Exports to India rose 5.1% to $10.2 billion. Imports from India dropped 7.9% to $1.3 billion. In the first five months of 2023, the top category of Indian exports to China was iron ore, accounting for $1.4 billion, or 23%, of $6 billion in shipments, according to TDM data. 

    In June, China ramped up purchases of commodities. Imports of natural gas increased 76.8% to 10.4 million tons. Its imports of iron ore increased 3.7% to $10.5 billion, while imports of copper rose 19.4% to 5.5 billion. And high-tech imports rose 6.5% to $61.7 billion. 

    In other areas, Chinese demand appears weak. Imports from the U.S. fell 0.6% to $13.7 billon. Imports of agricultural products fell 13.6% to $18.2 billion. Imports of meat, fresh or dried fruit and nuts, and vegetable oil all fell, while purchases of imports of grain and soybeans increased. And while exports to Russia increased 3.9% to $9.9 billion, imports from its ally dropped 10.2% to $10.4 billion. 

  • What’s Behind the High-Tech Trade Slump?

    What’s Behind the High-Tech Trade Slump?

    It’s not been an easy time for international trade, as a recent report co-authored by Trade Data Monitor and the World Intellectual Property Organization found.

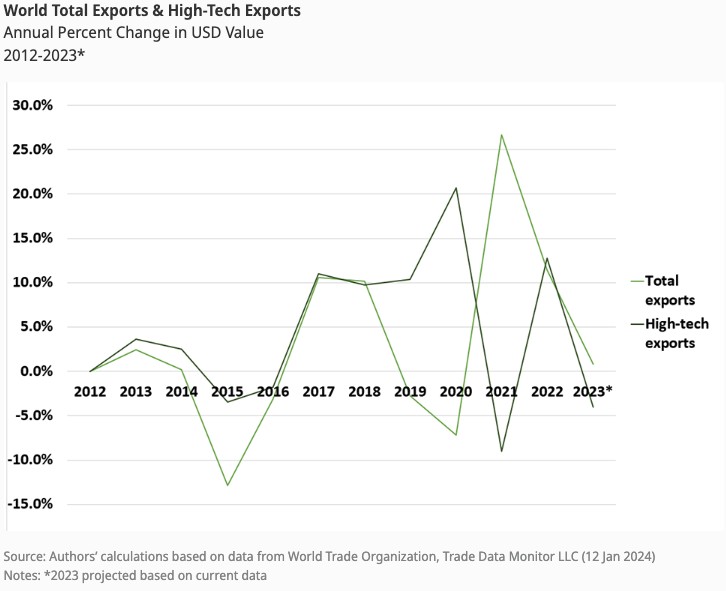
    High-tech exports are set to decline by 4 percent in 2023, according to the TDM/WIPO analysis. Global and high-tech trade have soared and sunk like rollercoasters since 2019. After the strong post-pandemic recovery in 2021 followed by a slowdown in 2022, total merchandise trade is expected to grow at a meagre 0.8 percent in 2023.

    Changing global value chains and geopolitical tensions are driving some of the trade slowdown, as well as inflation which is increasing the costs of traded high-tech goods. The development of new sectors, particularly in the manufacturing of renewable energies, batteries and electric vehicles, helps mitigate the high-tech growth slump, however.

    The key player, as a consumer and manufacturer, is still China, and Chinese high-tech exports fell 11.4% to USD 728.2 billion in the first 10 months of 2023. The country’s smartphone exports fell by close to 7% to USD 106.8 billion, and sales of its data processing machines dropped 24% to USD 82.8 billion (see Figure 3). Shipments to many of China’s traditional trading partners dropped. Exports to the U.S. fell by 21% to USD 102.7 billion; to the Republic of Korea by 13.4% to USD 33.9 billion, and to the Netherlands by close to 20% to USD 33 billion. Still, despite the decline, China is the leading high-tech exporter by far.

    Other Asian economies also experienced high-tech export declines. Exports of the Republic of Korea, for example, declined by 28% to USD 110 billion. Japanese exports fell 10% to USD 76.9 billion. Viet Nam’s export fared better, falling 1.7% to USD 115 billion in the first nine months of 2023.

    By contrast, U.S. high-tech exports rose 4.4% to USD 282.5 billion. Shipments to Germany, the Netherlands and Belgium all rose by double digits. U.S. exports of smartphones, routers, board and panels, parts for gas turbines, and computers all increased.

    Germany’s high-tech exports rose 6.6% to USD 217.4 billion over the first ten months of 2023. Exports of big airplanes rose 26.8% to USD 19.7 billion, shipments of immunological products rose 9.4% to USD 24.5 billion, and sales of processors and controllers, electric integrated circuits jumped 23.5% to USD 9.6 billion. And France’s high-tech exports increased 2.7% to USD 97.7 billion, thanks to increases in shipments of airplanes (up 16.9% to USD 19.7 billion), electronic integrated circuits (up 16.9% to USD 5.6 billion), and spacecraft, including satellites (up 438.4% to USD 2.1 billion). 

    Other fast-growing high-tech exporters in Europe include Austria, Hungary and Poland. Austria’s high-tech exports rose 16.9% to USD 22.1. billion in the first 10 months of 2023, thanks to hikes in shipments of anti-serum, up 26.7% to USD 3.8 billion, electrical panels, up 17.3% to USD 983 million, and transistors, up 40.8% to USD 650.1 million.

    Hungary’s high-tech exports increased 10.8% to USD 20 billion, on the back of sales of processors, up 11.2% to USD 2.3 billion, routers, up 27% to USD 1.7 billion, and smartphones, up 99.7% to USD 1.1 billion. Polish high-tech shipments increased 7% to USD 29.5 billion thanks to sales of data processing machines, airplane parts and hearing aids.

    John W. Miller

  • China Hikes Iron Ore, Copper Imports Amid Car Building Boom

    China Hikes Iron Ore, Copper Imports Amid Car Building Boom

    In the somewhat gloomy December and annual China trade statistics released in the second week of January was buried a piece of data that hearkened back to the boom years of Chinese commodity consumption: China is buying a lot more iron ore and copper.

    In December, China boosted iron ore imports 11.1% year-on-year to 100.9 million tons, worth $12.4 billion. Copper imports rose 18.2% to 2.5 million tons, worth $5.3 billon. These confirmed ongoing trends. For all of 2023, iron ore imports rose 6.6% to 1.2 billion tons, worth $134 billion. For the year, copper purchases rose 9.1% to 27.5 million tons, worth $60.1 billion.

    But the reasons for the big increase is no longer buildings and highways of a society punching its way into to global prosperity as it was in the early 2000s. Instead, these rising industrial commodity purchases are underpinned by China’s booming automobile and shipbuilding industries. Car exports rose 52% year-on-year in December to $8.9 billion. China, in fact, is set to pass Japan this year as the world’s number one auto exporter. Exports of ships, a related industry, increased 28.6% to $3.2 billion. 

    The headline numbers were less bullish, but perhaps not as bad as many feared, for China and the global economy. Total exports rose only 2.3% in December to $303.6 billion from $296.9 billion a year ago. For the year, exports dropped 4.6% to $3.4 trillion, a decline Chinese officials attributed to a faltering global economy. “The global economic recovery has been weak in the past year,” Lyu Daliang, a government spokesperson. “Sluggish external demand has hit China’s exports. Exports to the U.S. dropped 4.8% to $42.2 billion. Exports to ASEAN countries improved 0.4% to $50.2 billion. Exports to the EU dropped 1% to $42.8 billon. 

    Among the bright spots in partner countries, Chinese exports to India increased 8.5% to $10.5 billion, shipment to Russia increased 22.5% to $10.7 billion, and sales to Africa increased 9.5% to $15.3 billion. 

    There was a recovery in high-tech trade, driven by more demand for semiconductors and digital equipment. The work from home economy driven by the Covid-19 pandemic has subsided some, but it’s caused enough structural changes to undergird a new tech economy. For December, shipments of high-tech products increased 0.5% year-on-year to $77 billion, suggesting that the sector might be turning a corner after a dismal year. For all of 2023, high-tech exports dropped 10.8% year-on-year to $842.5 billion.

    Industrial commodities dented exports more than high-tech trade. China shrank exports of petroleum products 39.8% to 4.7 million tons. By value, they decreased 42.7% to $3.7 billion. Exports of fertilizers fell 26.8% to $707 million. Exports of steel products rose 45.4% to 7.7 million tons but they were sold at a discount. By value, they declined 8.7% to $6.4 million.

    The increases in copper and iron ore purchases were among outliers in Chinese imports. Total imports increased 0.2% to $228.3 billion from $227.9 billion. For the year, imports declined 5.5% to $2.6 trillion. China increased imports from the EU 0.4% to $24 billon. Imports from the U.S. dropped 4.3% to $14.9 billon. Imports from ASEAN countries fell 2.4% to $35.7 billion. There were a few bright spots among trading partners. Imports from India rose 24.1% to $1.5 billion. Imports from Russia increased 23.1% to $11.2 billion. Imports from Africa rose 4.3% to $8.8 billion. 

    And China’s appetite for coal, driven largely by demand from new power plants generating power for cities and a new generation of electric vehicles, showed no signs of abating. China increased coal imports 53% to 47.3 million tons, and by value 22.8% to $5.2 billion. For the year, China hiked purchases of the black rock 61.8% to 474.4 million tons, worth $53 billions.

    John W. Miller

  • Trade Data Monitor’s Top 10 Trade Trends Going Into 2024

    Trade Data Monitor’s Top 10 Trade Trends Going Into 2024

    It’s not an easy time for global trade–the roughly $25 trillion piece of the $105 trillion world economy. Protectionism is roaring in the U.S. and Europe, causing geopolitical tension with China. Inflation across most of the world has shrunk consumers’ wallets and imports, while deflation in China is also scaring businesses. Asian supply chains are slumping. After Russia’s invasion of Ukraine in 2022, the late 2023 conflict in Israel-Palestine has created more business uncertainty, danger for container ships transiting the Red Sea, and geopolitical tension. And then there’s the structural shifts in supply chains that have raised fears of deglobalization. That is probably less of a risk that people think. “We do see some signs in the data of trade fragmentation linked to geopolitical tensions,” said WTO chief economist Ralph Ossa. “Fortunately, broader deglobalization is not here yet. The data suggest that goods continue to be produced through complex supply chains, but that the extent of these chains may have plateaued, at least in the short run.” In other words, this is a time of change, more reason than ever to pay close attention to trends.

    Here are Trade Data Monitor’s top 10 ongoing trade trends at the start of 2024:

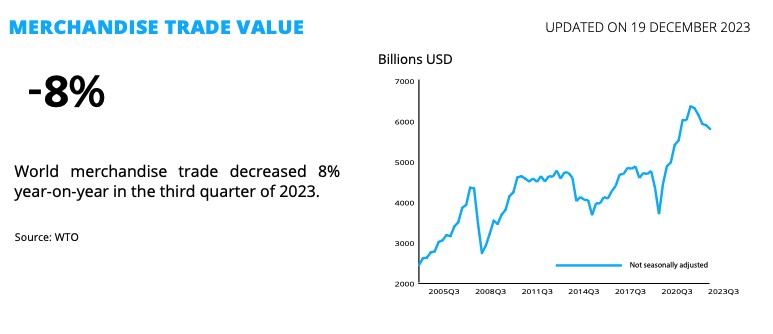
    1. Trade Crisis: Protectionism, price swings (inflation in the U.S. and Europe, deflation in China) and geopolitical tensions have created an uncertain environment for trade. The World Trade Organization now forecasts global trade to grow by only 0.8% in 2023, less than half the 1.7% increase predicted in April. For 2024, the WTO expects an increase of 3.3%, a modest recovery, but below the trend in the early 2000s.
    2. The COVID Effect: The COVID-19 pandemic depressed trade in 2020-2023, but now it’s triggered a booming in shipments of vaccines and medical test kits. The U.S. increased imports of medical test kits 46% to $44.7 billion in the 10 months of 2023. The top exporters of medical test kids are Switzerland (up 12% to $39.3 billion), Germany (up 9% to $24.5 billion), and the U.S. (up 11% to $16 billion), followed by Ireland, Belgium and the Netherlands.
    3. China Problem: It used to be that you could count on death, taxes and an uptick in Chinese exports. That’s no longer the case. Manufacturers have diversified their supply chains, consumers aren’t buying enough, and tariffs and export restrictions are rising. The upshot: In the first 11 months of 2023, Chinese exports declined 4% to $3.1 trillion. Exports to the U.S. over that time fell 13% to $463.7 billion.
    4. Asia’s Slump: China wasn’t the only Asian country to suffer declining exports. Singapore’s shipments fell 9.3% to $395.5 billion, South Korean exports declined 10% to $519.3 billion, and Japan’s sales fell 4.6% to $591.4 billion, and Taiwan’s exports fell 12.6% to $354.2 billion in the first 10 months of 2023.
    5. U.S. and European Rebound: The situation has been better for the U.S. and Europe. Supply chains are adjusting away from China, benefitting U.S. and European trade. Germany’s exports rose 1.5% to $1.4 trillion and French shipments increased 5.3% to $527.9 billion in the first 10 months of 2023. U.S exports declined 2.4% overall to $1.7 trillion, but that was mainly because of a decline in fuel prices. Shipments of electronics, machinery, cars, airplanes and pharmaceuticals all increased.
    6. Don’t Take Your Eye Off Electric Cars: Electric cars might be the most significant trade product in the world right now. Germany (up 86% in the first nine months of 2023 to $30.4 billion), China (up 112% to $25.1 billion), Belgium (up 78.1% to $13.3 billion), South Korea (up 89% to $10.4 billion) and the U.S. (up 41.4% to $5.8 billion) are leading the charge.
    7. The Energy Revolution: Investments in green energy, driven by governments and consumer demand, are propelling new trade flows. For example, U.S. imports of solar panels and related parts increased 70.1% to $19.5 billion in the first 10 months of 2023.
    8. Russia-China Trade: The huge boom in Russia-China trade, triggered by the war in Ukraine and subsequent U.S. and European sanctions, is still going on but it is finally showing signs of tapering off. Russia is now China’s sixth biggest source of imports and sixth biggest export destination. But after triple-digit increases in 2022, monthly increases are finally dropping. For example, in November 2023, Chinese exports to Russia increased 35% to $10.3 billion.  
    9. Regional Trade Boom: We’re seeing a healthy boom in regional trade networks. One example is the Middle East. For example, Iranian exports to Iraq (+73%) and Turkey (+32%) increased but the country’s shipments to China fell 16.3% in the first nine month of 2023. And the increases weren’t only driven by higher oil prices. Iran increased its oil exports to Iraq 332.8% to 88.4 million barrels in the first nine months of 2023.
    10. China is Buying All the Coal: While much of the rest of the world is trying to wean itself from fossil fuels, especially the dirtiest one, coal, China is ramping up imports. Ironically, it needs coal partly to power a new generation of power plants pumping out electricity for electric car batteries. In the first 10 months of 2023, it hiked purchases of the black rock 38% to $33.5 billion by value, and 96.6% by quantity to 250.3 million tons.

    John W. Miller is Trade Data Monitor’s Chief Economic Analyst, in charge of writing TDM Insights, a newsletter analyzing key issues through trade statistics. John is an award-winning journalist who’s reported from 45 countries for the Wall Street Journal, Time Magazine, and NPR.

  • TDM Data Used to Scrutinize Impact of Steel and Aluminum Tariffs

    TDM Data Used to Scrutinize Impact of Steel and Aluminum Tariffs

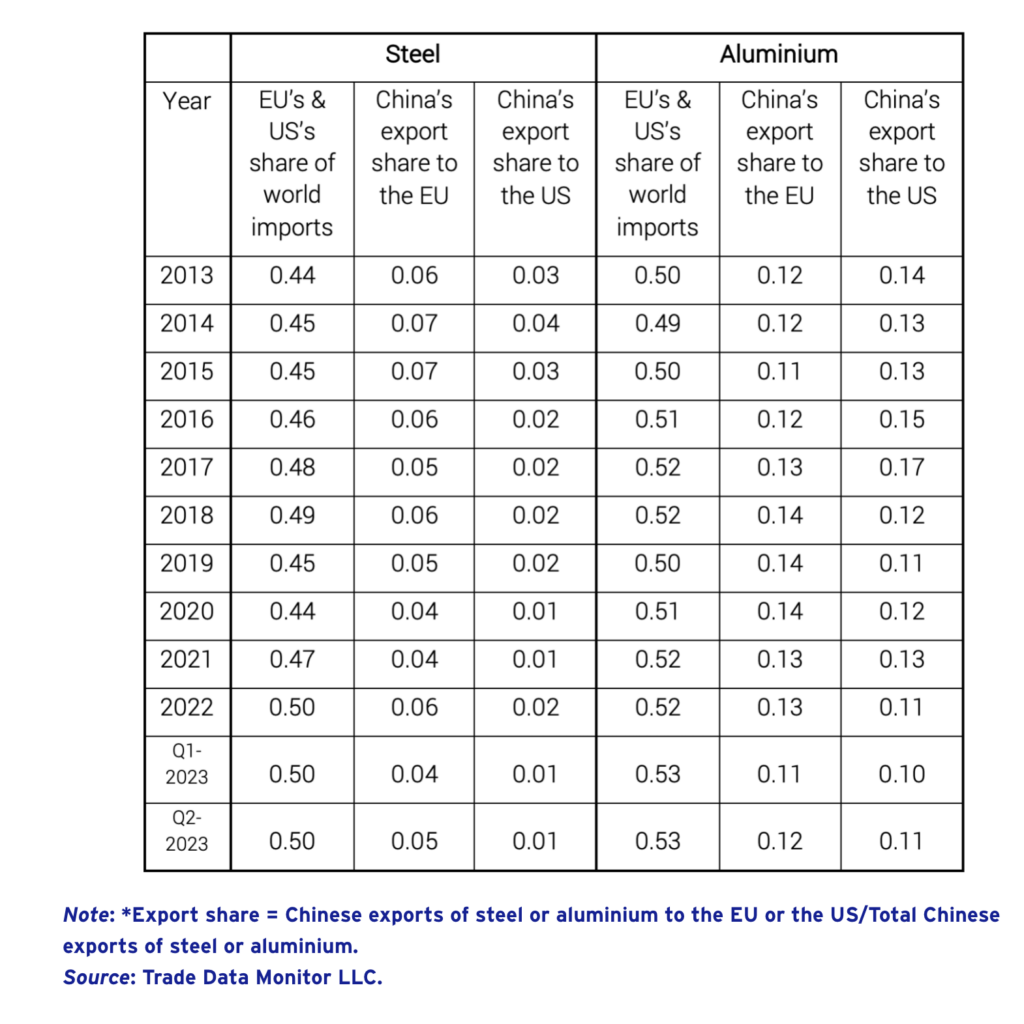
    Trade scholars in a recent paper used Trade Data Monitor data on steel and aluminum trade to gauge the impact of 2018-2019 protectionist measures on U.S. and European Union imports.

    The paper by Simon Evenett and Fernando Martin, published by the Center for European Policy Research, found that because the U.S. and European Union import relatively small quantities of Chinese metals, “limited EU and US leverage is unlikely to change investment plans of Chinese steel producers.” If the U.S. and EU raise tariffs, Chinese exports will be redirected to “third markets – and this may not be without cost to Chinese firms that may have to accept lower export prices.”

    For example, China accounted for only 11% of U.S. aluminum imports and 2% of steel imports in 2022, according to TDM data.

    The U.S. and EU have been negotiating a new agreement on steel and aluminum trade known as the Global Arrangement on Sustainable Steel and Aluminum, to “address carbon emissions on steel and aluminum” while restoring “market-oriented conditions.”

    The paper found that “while EU and US purchases of steel and aluminum account for half of world imports, so diversified are China’s exports that transatlantic leverage over Chinese producers is likely to disappoint. Further trade deflection, not accelerated Chinese decarbonisation, is the likely outcome of any climate-related sectoral trade deal.”

  • China Boosts Imports of Raw Materials by Double Digits

    China Boosts Imports of Raw Materials by Double Digits

    China in October dramatically increased imports of fossil fuels, industrial metals and agricultural commodities, a run on raw materials that if sustained will have a major impact on prices and supply chains.

    China continued to increase its ferocious energy consumption, hiking imports of natural gas 120.1% year-on-year to 8.8 million tons, coal 23.3% to 36 million tons, and crude oil 13.6% to 49 million tons.

    It also increased imports of industrial metals used in construction, automotive, high-tech, and defense, buying 23.8% more copper, up to 2.3 million tons, and 4.9% more iron ore, up to 99.4 million tons. One possible reason for the increased demand for commodities is a rebound in the real estate market. The Chinese central bank has simplified lending rules, given first-time home buyers lower interest rates, and will issue hundreds of billions of dollars’ worth of bonds for infrastructure. 

    In agriculture markets, China reduced shipments of meat, but increased imports of fruits and nuts 26.4%, grain 38.4%, soybeans 25.2% and vegetable oil 27.2%.

    Buying from Africa and Latin America

    Given this hungry appetite for commodities, it’s no wonder that China is increasing trade with resource-rich countries of Africa and Latin America. Imports into China from Latin America jumped 28% to $20.7 billion. Imports from Brazil increased 40.4% to $10.6 billion. Imports from Africa jumped 22.9% to $10 billion, and imports from South Africa rose 23% to $2.9 billion.

    Overall, Chinese imports rose 3% year-on-year to $218.3 billion, while exports declined 6.6% to $274.8 billion. The resulting trade surplus, $56.5 billion, dropped over 30% from $77.7 billion in September.

    Volatility of Global Trade

    Global trade is in the most volatile period it’s been in since the end of the Cold War. There are wars ongoing in Ukraine and the Middle East, a green energy and electric car revolution, rising protectionism and tension between China and its top trading partners, the U.S. and Europe.

    It remains to be seen whether China will continue to aggressively expand its trade with the Global South. By comparison, imports from the EU rose 6.8% to $22.7 billon. Imports from the U.S. fell 2.3% to $12.3 billion. Imports from ASEAN countries rose 10% to $36.7 billion. Imports from Japan fell 7.8% to $13.5 billion. Even the China-Russia trade boom seems to be finally leveling off: Purchases from Russia rose only 7.2% to $11.1 billion.

    The Problem of China’s Export Slump

    The rising imports contrasted with a continued drop in exports. The slump is cutting across almost all commodities. Exports of high-tech products fell 8% to $74.8 billion. Exports of luggage, footwear, toys and textiles all dropped.

    Underlying those declines is the persistence of weakening economies in rich countries. Exports to the EU fell 12.2% to $38.6 billion. Exports to the U.S. dropped 7.6% to $43.2 billion. Exports to ASEAN countries decreased 12.6% to $41.5 billion. Exports to Japan fell 12.8% to $12.9 billion. 

    There were exceptions in some markets, including, as has always been the case recently, in automotive. But it wasn’t just cars. Exports of ships rose 34.3% to $2.8 billion, and sales of mobile phones rebounded, rising 21.8% to $18.7 billion.

    Solutions to Trade Wars

    One of the causes of lower exports is that foreign direct investment into China by foreign companies has been dropping. Beijing has said that FDI declined almost $12 billion year-on-year in the quarter between July and September.

    Chinese prime minister Li Qiang promised this weekend to make China a more attractive place for foreign companies to invest, an “continue to create a market-oriented, legal, and international business environment.”

    And China is also working to reduce protectionism. Its trade officials have been in talks with Australia to resume trading after a breakdown in trade ties over a series of disputes, amplified by Australia’s inquiries into the origins of Covid-19.