Author: John Miller

  • Trade Statistics Show Inflation

    Trade Statistics Show Inflation

     AI is Still Driving Trade

    Despite an increase in protectionism and tariffs, global trade has persisted at a steady pace thanks to a boom in sales of new technologies related to artificial intelligence. The war in the Middle East and subsequent energy crisis have only made economies more focused on restructuring in an environmentally friendly way. 

    That’s why the world’s top trade power, China, has continued to ramp up exports. In May, Beijing’s General Administration of Customs said on Tuesday, exports increased 19.4% year-on-year to $376.8 billion. 

    “The war is boosting demand for green exports, such as electric vehicles, batteries, solar products, and AI-related technology goods, which are linked to China’s structural focus,” Sheana Yue, a senior economist at Oxford Economics, wrote in a note. “China, relatively insulated from energy-related cost shocks, retains advantages in scale, supply-chain depth and industrial capacity.” Overall, Exports of high-tech goods increased 51.1% to $112.1 billion.

    Inflation is Starting to Show up in Trade Data

    However, trade data is starting to show another trend that could ruin the party: inflation. Consider this: The number of integrated circuits exported by China increased 2.1% to 30.7 billion. The value of these shipments rose 111% to $35.5 billion, representing, roughly, a doubling of prices over 12 months. 

    Exports of “automatic data processing equipment and parts thereof”, for which there is no data on quantities, rose 66.1% to $26.9 billion. 

    There were price increases across other categories, too. Exports of “unwrought aluminum and aluminum products”, for example, increased 15.6% by quantity but 38.4% by value. Exports of rare earths declined 6.4% by quantity but increased 237% by value. (The total value of rare earths exports, we should point out, amounted only to a paltry $63 million.) The number of mobile phones exported dropped 3.5% to 53.4 million. By value, they increased 44.3% to $9.9 billion. 

    Exports to the U.S. Are Back Up 

    A year ago, the world was in the throes of a U.S.-China trade war. Washington’s tariffs on Chinese imports were over 100%. Twelve months later, the relations have thawed, including a visit by President Trump to Beijing, and commerce between the world’s two trade powerhouses.  Exports to the U.S. increased 35.6% year-on-year to $39 billion. Imports from the U.S. rose 20.2% to $13 billion. 

    Trade with Europe, which had been booming, has stabilized. Exports to the EU increased 7.6% to $53.2 billion, while shipments from the EU shrank 1.3% to $22.6 billion. 

    Those numbers are dwarfed by China’s trade with its Asian neighbors. Exports to ASEAN nations rose 24.7% to $72.6 billion, while imports increased 27.9% to $40.1 billion. Exports to Canada declined 2.6% to $4.6 billion. Imports from Canada increased 98.6% to $7.2 billion. 

    Energy Markets Are Adapting

    The crisis in the Middle East, and the impasse in the Strait of Hormuz has disrupted energy trade. Chinese imports of crude petroleum oil fell 29% to 33.1 million tons while imports of natural gas increased 111.3% to 10.1 million tons. China is the world’s biggest energy importer. The looming shortages of fossil fuels will only help stimulate China’s lucrative electric vehicle trade. Exports of motor vehicles increased 39.3% to $16.7 billion. By number they increased 42.5% to 987,588. “Support should continue from stronger demand for sustainable energy products amid the oil supply squeeze,” HSBC said in a note.

    China is Buying…Asian Tech

    Imports increased 27.5% to $271.3 billion, but analysts cautioned that this doesn’t mean China will start buying as much from the world as the world buys from it. In a word, China is also building out its AI capabilities. “China’s import growth remains mainly a tech story rather than an energy story,” ING wrote in a blog post. That’s why imports from South Korea, ING pointed out, rose 83.4% to $26.7 billion. Imports of high-tech goods, however, rose 46.9% to $96.6 billion.

    Purchases of agricultural products, by comparison, increased only 4% to $20.7 billion, and imports of pharmaceuticals fell 9.3% to $4 billion. 

    But it almost doesn’t matter how much Chinese imports are growing; they are unlikely to outpace the country’s export juggernaut. In May, Beijing’s trade surplus increased to $105.4 billion from $84.8 billion the month before.

  • Is The U.S.-China Trade War Over?

    Is The U.S.-China Trade War Over?

    U.S.-China Summit This Week

    When Presidents Donald Trump and Xi Jinping meet in Beijing, trade, for once, won’t be the primary topic. Among more severe crises in play are the U.S. war with Iran, the rise of artificial intelligence, and China’s desire to annex Taiwan. After the Trump’s imposition of triple-digit tariffs last year, Beijing and Washington agreed to a one-year trade truce in October that imposes tariffs averaging 47% on Chinese exports to the U.S. and around 30% on goods going the other way. 

     China Boosts Exports

    This weekend, China said its exports to the rest of the world had increased 14.1% year-on-year to $359.4 billion. That was a surprisingly strong performance for a Chinese export economy that’s struggled to find its footing this decade. In March, exports increased only 2.5%, and a group of economists recently interviewed by the Wall Street Journal summoned an estimated expansion for April of only 8%. China’s manufacturers had suffered more than most from the conflict in the Middle East and the difficulty navigating the Strait of Hormuz.

    Trade to the U.S. Recovers

    Exports to the U.S. rose 11.4% to $36.8 billion. In the first quarter of 2026, by contrast, shipments to the U.S. dropped 16.3% to $96.7 billion. What’s going on here? In part, it signals a stabilization after the hard dip caused by tariffs a year ago. April 2025 is when Chinese exports to the U.S. really got hit: That month Chinese exports to the U.S. dropped 21.1% to $33 billion. By comparison in March 2025, they increased 8.7% to $40 billion. With a lower baseline, expect Chinese exports to the U.S. to stay flat on increased slightly year-on-year. To be sure, last year, despite the slowdown in trade with the U.S., China set a record with a $1.2 trillion trade surplus. 

    But the April numbers suggest that the U.S. could be losing leverage. Before Trump, the U.S. had imposed some of the lowest tariffs in global economic history, the result of its postwar liberalization philosophy. The U.S. under Trump has used the negotiating power offered by those low tariffs to exact concessions from enemies and friends. Now, however, “China looks to have more leverage,” Capital Economics wrote in a report. “Higher tariffs haven’t stopped China’s exports from continuing to surge over the past year, and Beijing has showed that it is prepared to wait out U.S. pressure.”

    Semiconductors and Cars

    The rest of China’s trading partners gobbled up cars, semiconductors, and other high-tech goods the country is currently manufacturing. Shipments to the European Union increased 13.6% to $53 billion, and sales to ASEAN nations rose 15.4% to $69.5 billion. Exports to Brazil increased 37.1% to $7.8 billion. 

    Exports of “automatic data processing machines and parts thereof” increased 47.7% to $23.8 billion. Shipments of high-tech products spiked 39.3% to $104 billion. Exports of motor vehicles increased 44% to $16.1 billion. By contrast, sales of ag products increased 3.8% to $8.8 billion. 

    China’s Buying

    China’s economy imported $274.6 worth of goods in April, up 25.3% year-on-year, after rising 27.8% in March. The Wall Street Journal economists had predicted a rise of 16%.

    China is importing components for its booming tech industry. Imports of high-tech products rose 42.1% to $95.9 billion. Imports from the EU increased 14.6% to $23 billon, purchases from the U.S. increased 9.4% to $13.7 billion, and shipments from ASEAN countries rose 29.1% to $42.7 billion. Imports from India rose 32.3% to $2.3 billion. But there are signs that the Strait of Hormuz closure is having an impact. Imports of crude petroleum, most of it from the Middle East, dropped 19.9% to 38.5 million tons. Imports of natural gas, from countries like Russia, increased 83.1% to 8.4 million tons.

    As always, when he arrives in Beijing, President Trump will ask China to buy more American goods. With duties already on the board, and courts in the U.S. now limiting his tariff power, the trade war, if not over, has become much harder for the U.S. to fight. 

  • How AI Is Driving Global Trade

    How AI Is Driving Global Trade

    Lower Growth in China 

    In early March, Chinese leadership set their lowest gross domestic product growth target since 1991, forecasting a 4.5% to 5% expansion for its economy in 2026. 

    This week, China reported a 21.8% year-on-year increase in exports for January and February to $656.6 billion. To avoid distorted numbers because of Chinese New Year, the government in Beijing always reports combined trade data for the two months of the year. 

    This big increase handily beat analyst predictions, and, after a modest 6.6% year-on-year bump in December, defied aggressive action by the U.S. to curb commerce with China. 

    Part of the Chinese trade resurgence is due to an intentional strategy by Chinese policymakers to goose exports by cutting prices and finding new markets. Exports to ASEAN countries rose 29.4% to $112.6 billion, while shipments to the EU expanded 27.8% to $101 billion.

    The AI Global Trade Economy

    Another reason for the increase is the booming tech economy based around intense investments in artificial intelligence technology. China’s exports of integrated circuits, a category which includes the semiconductors used to power AI systems, increased 72.6% to $43.3 billion. Imports of those circuits jumped 39.8% to $78.2 billion.

    The AI buildout is happening around the world, and it’s changing the composition of the Chinese tech economy. Suppliers once flocked to China to manufacture finished consumer goods like smartphones. Now, they’re more likely to make electronic and industrial parts in China that then get finished in other countries. That’s why exports of mobile phones dropped 8.3% to $17.1 billion, even as overall shipments of high-tech products rose 26.9% to $167.2 billion. 

    One consumer product China is still dominating: Cars. Chinese exports of motor vehicles kept on vrooming upward, rising 57.9% to 1.5 million units. By value, they increased 67.1% to $27 billion. 

    China’s surplus only appears to be growing, raising the stakes around the world for protectionist policies. In 2025, China ran a record $1.2 trillion surplus. 

    U.S.-China Trade in Flux

    In one respect, the U.S. strategy to restrict trade is working: Exports to the U.S. dropped 11% to $67.2 billion. In February, the Supreme Court ruled that the Trump administration was illegally using an emergency power to apply tariffs on foreign imports. In response, Trump promised to a standard 10% tariff that he will eventually bump up to 15%. That could end up helping China, as it lowers their tariff rate relative to other countries. 

    However, China has been ramping up exports to other countries. Sales to France rose 31.9% to $8.5 billion, exports to Italy leapt 36.4% to $9.9 billion, and shipments to Russia rose 22.7% to $18.3 billion. 

    China has abandoned the low-tech staples of its early economic development, but with so much capacity, there have been occasional resurgence in the manufacture and exports of some categories. Exports of furniture, for example, rose 24.7% to $12.4 billion. However, shipments of toys ticked up only 1.5% to $5.1 billion. 

    The Importance of the Chinese Consumer

    Despite the low growth expectations, total imports increased 19.8% to $443 billion. China’s consumers have more appetite, and money, for purchasing foreign goods. Policymakers in Beijing have been focused on getting consumers in China to spend and invest more. At the same time, exporting manufacturers need raw materials and parts for making their goods. Imports of high-tech products increased 27.7% to $139.8 billion. 

    One thing is certain: They’re not buying American. Imports from the U.S. fell 26.7% to $19.4 billon. Trump is due to visit China at the end of March. 

    By comparison, imports from the European Union increased 11.7% to $41.2 billion, and purchases from ASEAN nations rose 12.9% to $63.9 billion. One region increasingly benefitted from China’s importing strategy is Latin America. Imports, mostly of commodities like copper, iron ore, and soybeans, jumped 28.9% to $46.5 billion. Notably, imports from France rose 28.2% to $6.1 billion, and imports from Russia increased 4.1% to $20.8 billion. 

    One item China will likely have to import more of is petroleum, as the war in Iran scrambles supply routes around the Strait of Hormuz. In the first two months, China hiked imports of crude 15.8% to 96.9 million tons. 

  • Global Trade is Moving On — Without the U.S.

    Global Trade is Moving On — Without the U.S.

    One way of looking at China’s trade economy in December and for the full 2025 year is its export surge, amplified by a weak currency, deflation at home, and inflation in most of the rest of the world. China pumped up total monthly exports 6.6% to $357.8 billion in December from $335.6 billion over the same period in 2024. 

    Here’s another angle: Washington’s efforts to crimp Beijing’s industrial sector have resulted in diminished U.S.-China trade, but even bigger Chinese surpluses with the rest of the world, and evolutions in global trade that are simply leaving America behind. For the full year, China exported $3.8 trillion worth of goods. Minus imports, that made for a total surplus of $1.19 trillion, the biggest in recorded economic history. 

    Chinese officials themselves have drawn direct links between U.S. policy and its surplus, saying in effect that without tariffs, Beijing would have bought more goods from the rest of the world. “Some countries have politicized economic and trade issues and restricted exports of high-tech products to China for various reasons; otherwise, we would have imported even more,” Wang Jun, a Chinese trade official, told reporters Wednesday. 

    According to the Petersen Institute for international economics, U.S. tariffs on Chinese exports average around 47%, while China’s average tariffs on US exports are around 32%.

    The Chinese export juggernaut needs markets like nature abhors a vacuum, and it’s found new landing places for its voluminous container ships. Exports to the European Union increased 11.5% in December to $51.9 billion. Exports to Germany increased 13% to $11 billion. By comparison, exports to the U.S. fell 30.2% to $34.2 billon. We are seeing the wheels of human economic history turn in real time. Global trade is still inching upward every year. The rest of the world is getting on with it, leaving the U.S. behind. While ports on the East and West coasts slow their activity, they’re busy in Asia, Europe, Latin America and Africa. Exports to ASEAN nations increased 11.3% to $66.4 billion, including a 20.4% jump to Vietnam to $18.9 billion; shipments to Latin America rose 9.8% to $25.7 billion; and sales to India increased 22.1% to $12.8 billion.  

    The story of global trade right now is geopolitics. It’s the jolt of the U.S. away from its post-war free trade consensus. There is another story we’ve discussed here that is less surprising but still ongoing. It’s the move of China and other Asian countries up the value chain, away from toys and shoes and into tech and cars. At the same time, countries like Egypt, Bangladesh and Cambodia continue to build up their apparel and textile exports. 

    In December, Chinese exports of high-tech products increased 16.7% to $93.7 billion. Sales of motor vehicles increased 73.2% to 994,000. By value, they rose 71.7% to $17.1 billion. Exports of toys fell 19.4% to $2.7 billion. Shipments of footwear dropped 17.4% to $3.9 billion. 

    On the import side, China ramped up purchases 5.7% to $243.6 billion from $230.5 billion. The relationship with the EU seems more two-sided than in the past. Imports from the EU rose 17.9% to $26.9 billion, while purchases from the U.S. plummeted 28.6% to $10.9 billion. Imports from Germany increased 13.6% to $8.9 billion. Imports from Latin America increased 26.8% to $24.4 billion. Imports from India rose 56.5% to $2.2 billion.

    Buying more from Europe and Latin America was also at the expense of some Asian neighbors. Imports from ASEAN countries fell 5.1% to $35.7 billion. Even imports from Vietnam were flat at $9.5 billion. 

    Imports of high-tech products rose 13.6% to $82.6 billion. Purchases of soybeans increased 4.7% to $3.9 billion. China still needs a protein supply, and it’s getting it from Brazil instead of the U.S.

    One sign the Chinese economy is doing just fine: China ramped up purchases of natural resources. It increased quantities of imports of iron ore by 6.5%, copper 7.3%, coal 11.9%, oil 17.4%, and natural gas 90.2%.

  • TDM’s Top 10 Trade Trends to Watch in 2026

    TDM’s Top 10 Trade Trends to Watch in 2026

    Happy New Year. While we wait on the Supreme Court to rule whether the Trump administration is entitled to apply tariffs on national security grounds, global trade grinds on. We at Trade Data Monitor are paying attention to what’s happening via the prism of official trade statistics. It’s a radically different world than when I started covering trade for the Wall Street Journal 20 years ago. The biggest story is still in tech, where the economy is being transformed by investment in chips and other electronics used to make artificial intelligence systems. Shut out of the U.S., many Chinese exporters are finding new markets in Europe. Beijing is not giving up its export-dependent growth model, which in 2025 propelled the world’s first-ever trillion-dollar trade surplus. Via our system for reverse engineering trade data, we can discern that Russia’s import demand is shrinking. Vietnam is still climbing the economic ladder, thanks to an export portfolio that includes staples like toys and shoes, but also high-value electronics. Most of the world has not given up on trade. In October, global container volumes increased 2.1%. However, the U.S. is an outlier. According to Bloomberg, the U.S. saw an 8% contraction in inbound shipments. Although President Trump threatened much higher levies, the U.S. effective tariff rate is “only” around 15%. That’s its highest level since the 1930s, and it’s the main reason the WTO is now forecasting 0.5% growth in global trade in 2026, instead of 1.8%.Here are our top trade trends to watch in 2026.
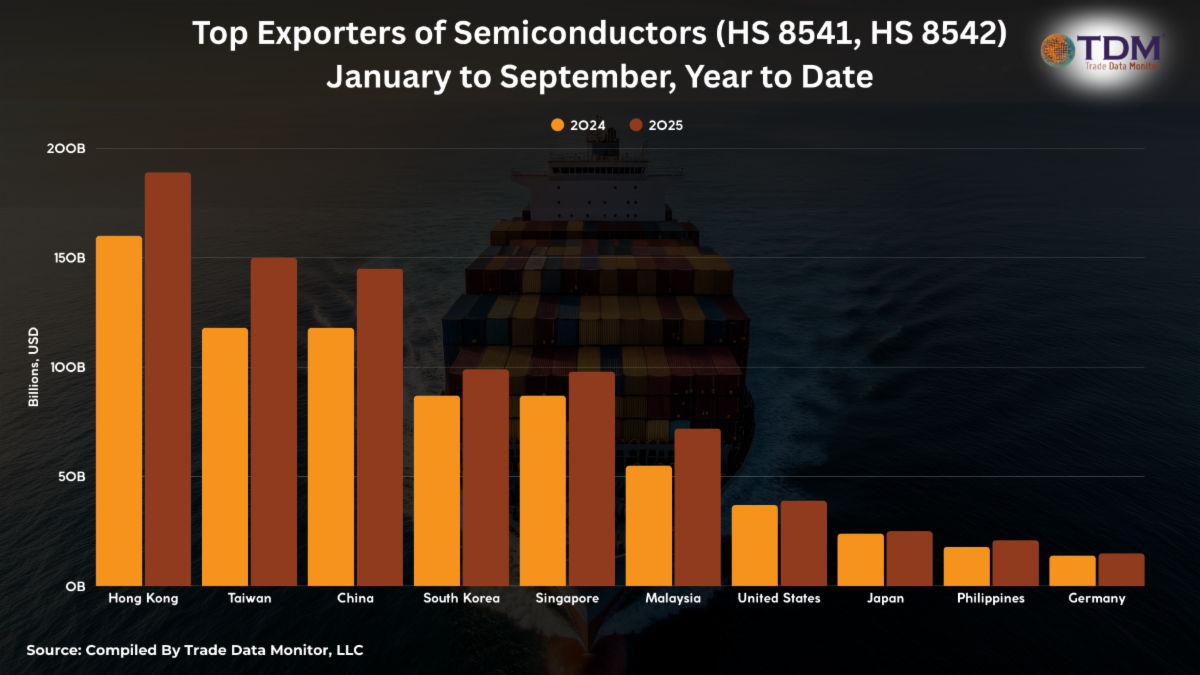
    1.   The Asian Chip MiracleThe chip market is expected to reach around $750 billion in 2026 and hit $2 trillion by the early 2030s. In its latest incarnation that trend is being led by Asia. Eight of the world’s top 10 exporters of chips, classified under HS8541 and HS8542 are Asian. Only the U.S. and Germany crack the top 10. 
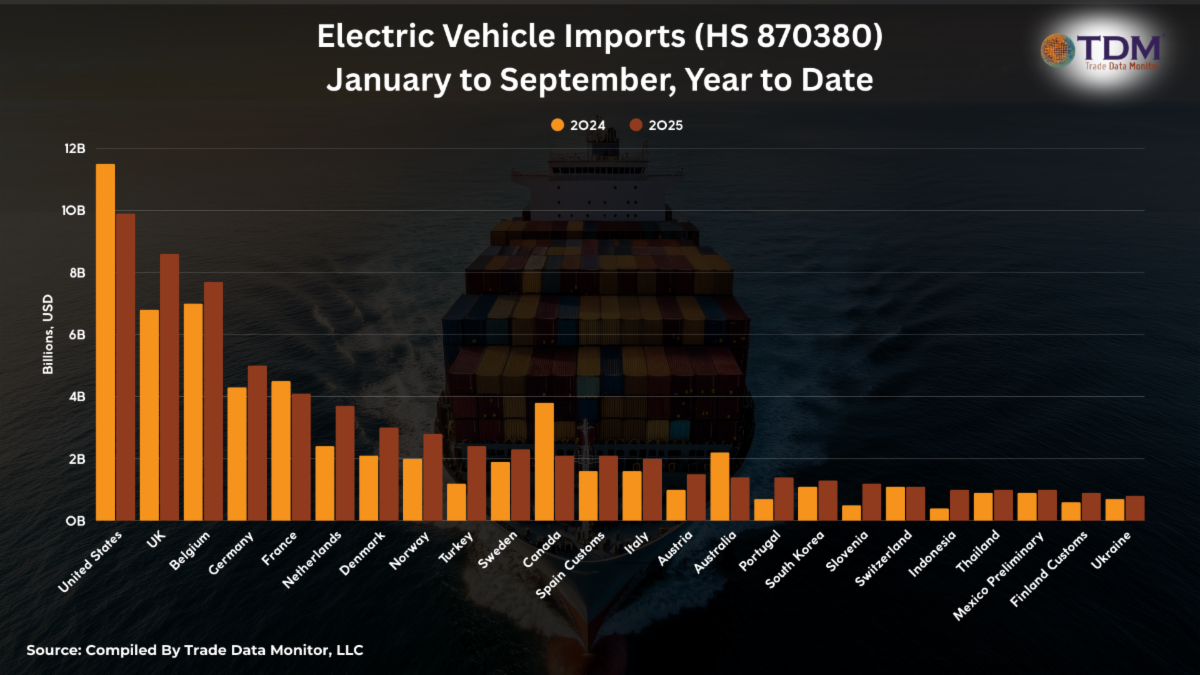
    Thanks in part to the chip industry, and parallel industries in batteries, engines and electronics, the electric vehicle industry is thriving. Slowly, the world’s road and filling stations are being rewired. In country after country, electric car imports have been increasing.  One consequence is booming trade in the critical minerals, like cobalt, manganese and nickel, needed to build electric cars and batteries. We’ll explore that trade in our February newsletter. 
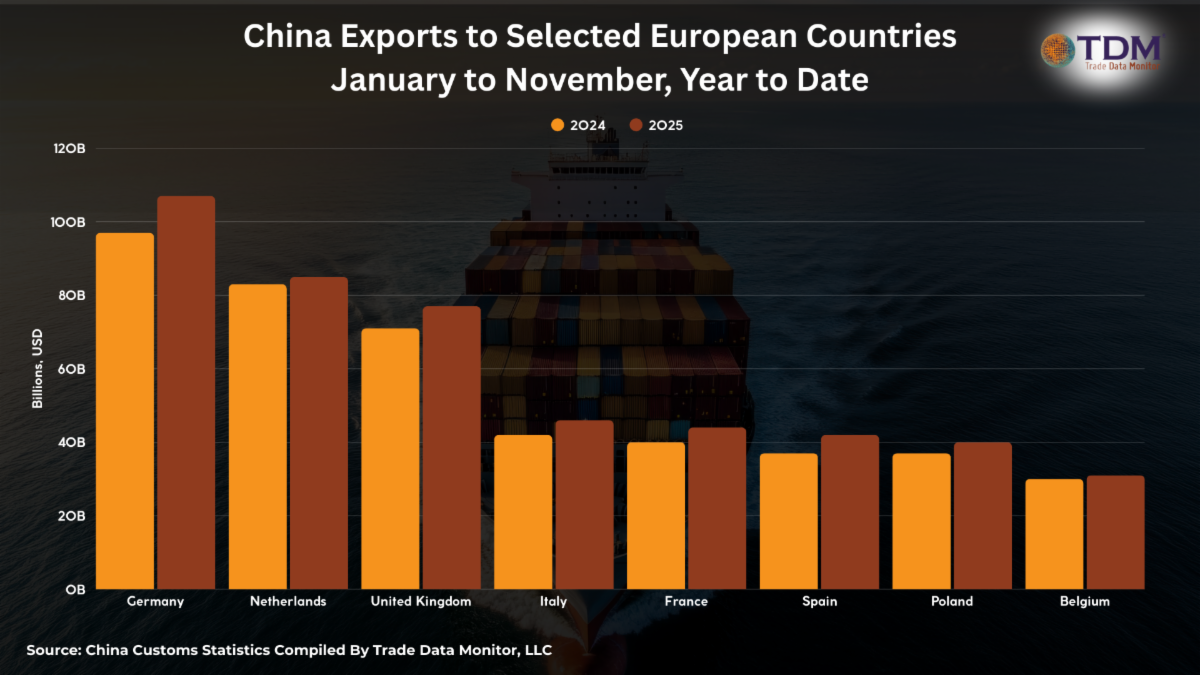
    2.   China Finding Markets in EuropeWith the U.S. throwing up roadblocks, Chinese exporters have been finding markets in Europe. That’s triggered a crisis for European domestic manufacturers, who are now having to compete with the China price Americans have turned down.
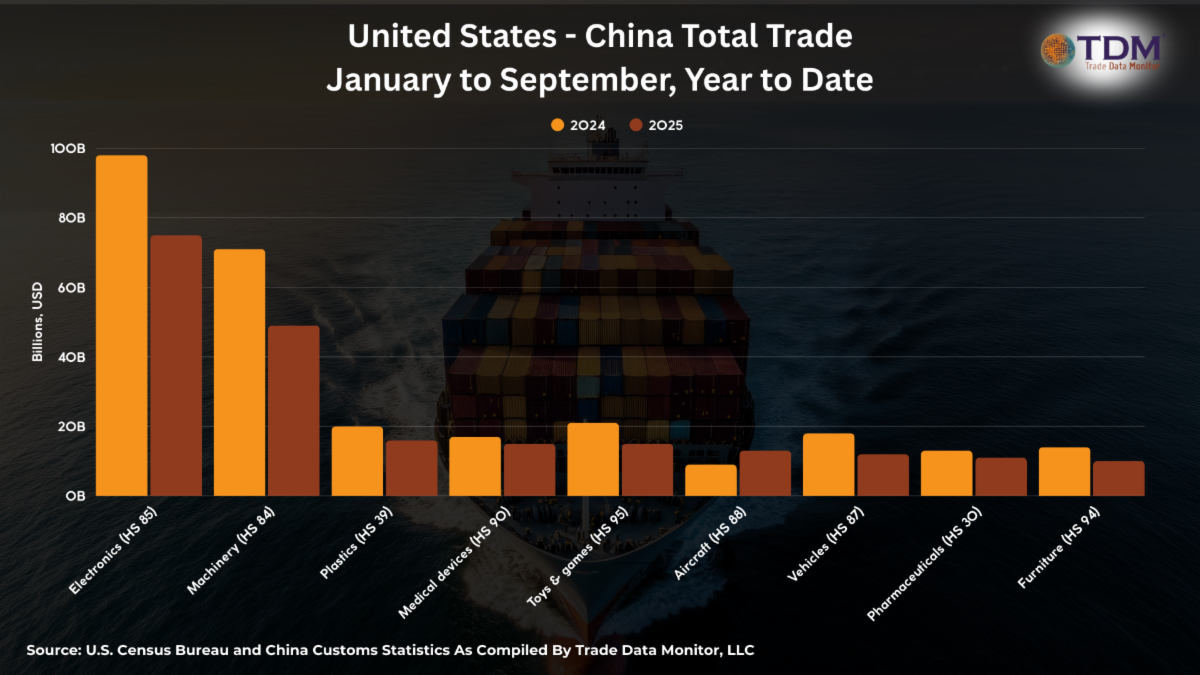
    3.   Where is U.S.-China Trade Headed?The future of the U.S.-China trade relationship seems uncertain at best. When we added up total trade between the two behemoths, the only sector has grew in 2025 was aircraft. The U.S. shipped $12.5 billion of aircraft and aircraft parts to China in the first nine months of 2025, up 45% from the same period in 2024.
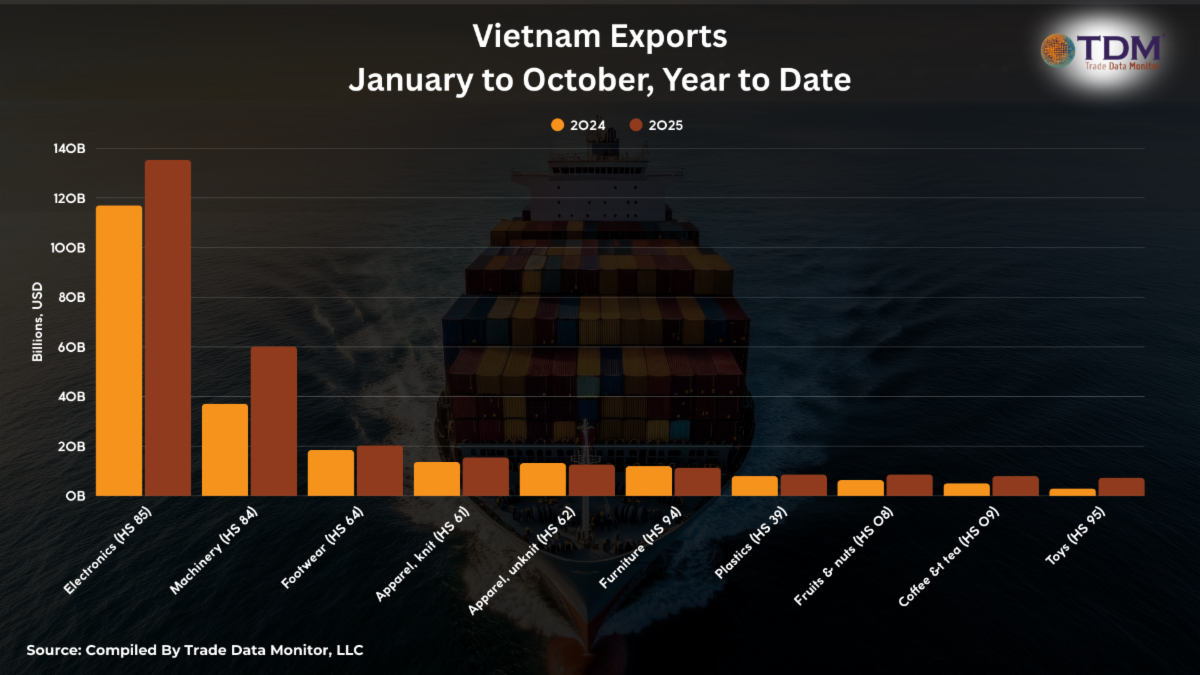
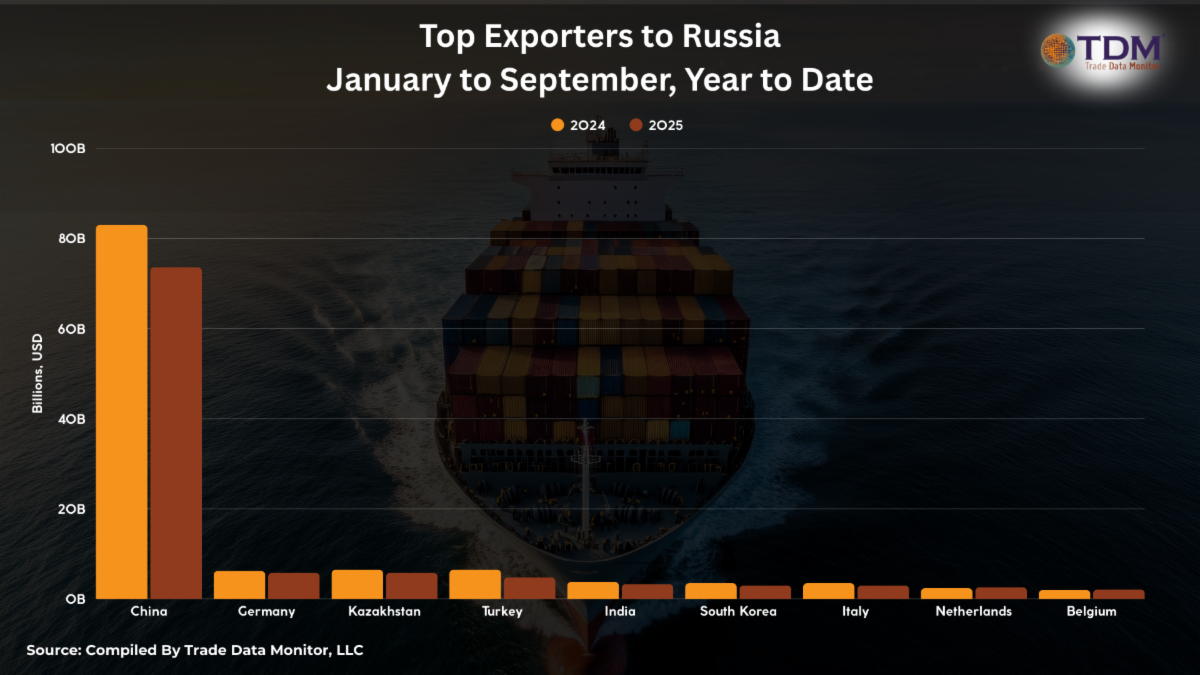
    4.   How Vietnam is Winning Global TradeAt TDM, we’ve been talking about Vietnam’s promise for a decade, so we’re not surprised to see its strong export numbers. The remarkable thing about Vietnam isn’t that it has become an export machine, it’s that its manufacturing capacity has increased across so broad a base. 5.   Russia’s Shrinking Import DemandRussia still isn’t publishing trade statistics, but thanks to the breadth of TDM’s database, we can look at which countries are shipping to Russia. Those exports to Russia are mostly shrinking, an indication of the battering Russia has been taking from the war. The IMF and other institutions predict Russian GDP growth of only around 1% in 2026. 
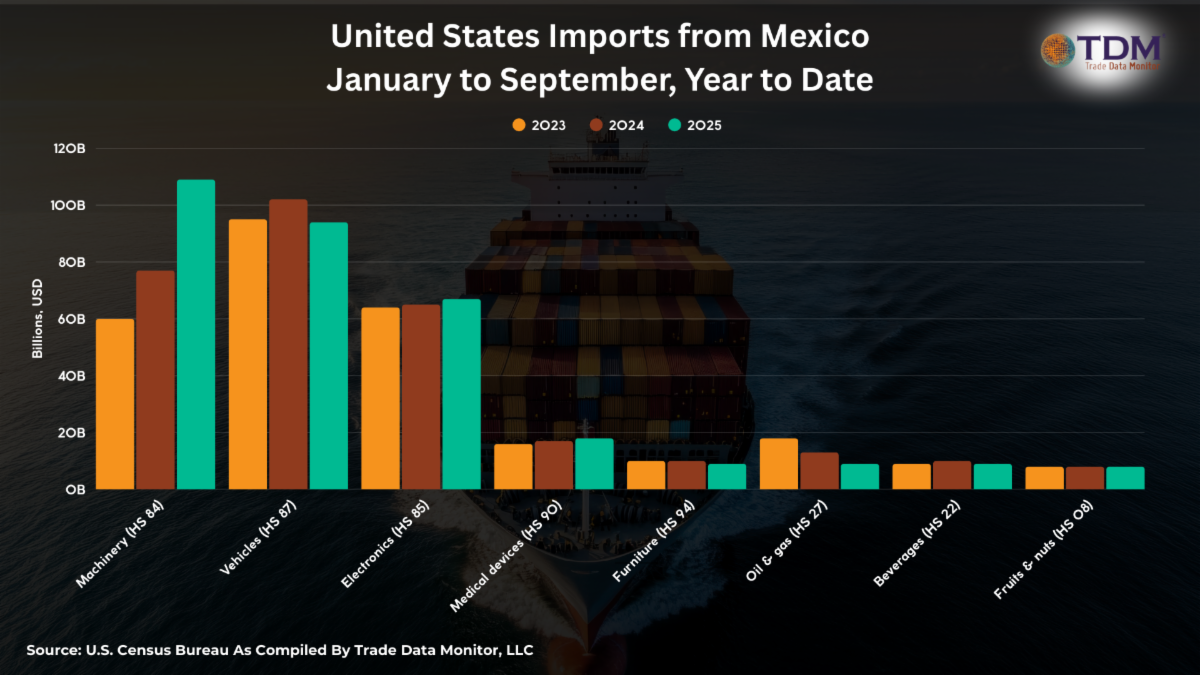
     6.   U.S. Imports from MexicoThe biggest beneficiary of the U.S.’s trade war with China has been Mexico. Although the two countries, and Canada, are now renegotiating the USMCA, businesses have had confidence they can manufacture in Mexico and ship north. Mexico has been suppressing data, but U.S. import statistics paint a picture.
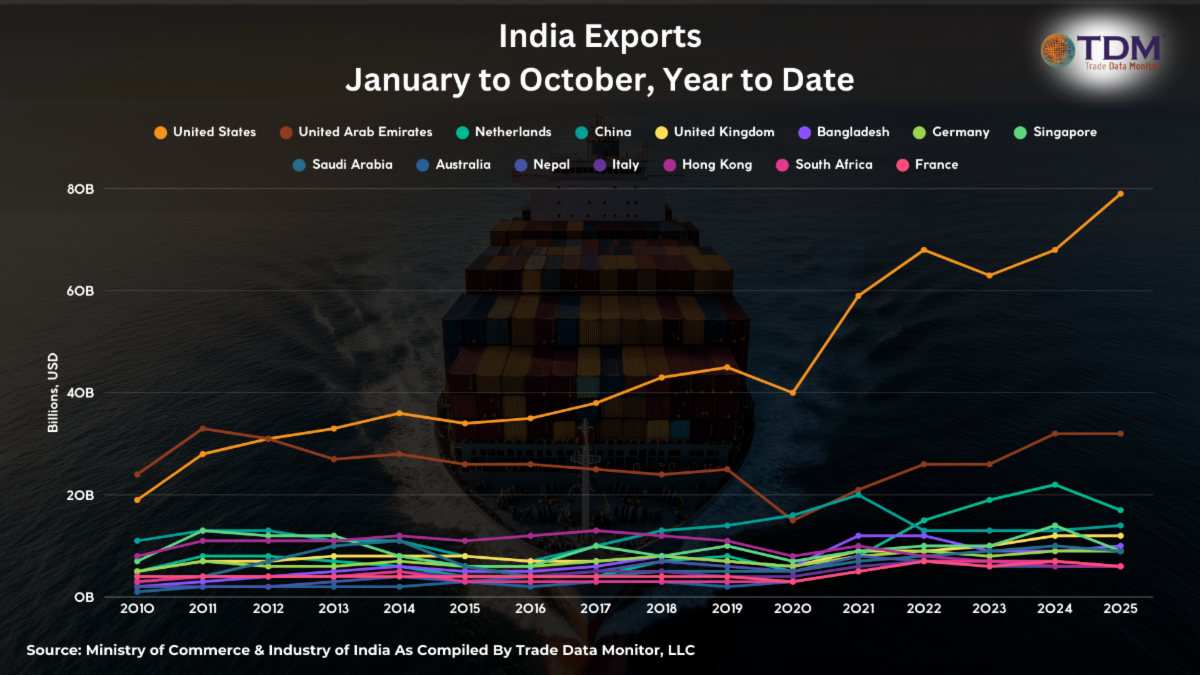
    7.   Indian ExportsNow with the world’s biggest population, India has now overtaken Japan as the world’s fourth biggest economy, behind the U.S., China and Germany. Its top market: the U.S., followed by UAE and the Netherlands. 
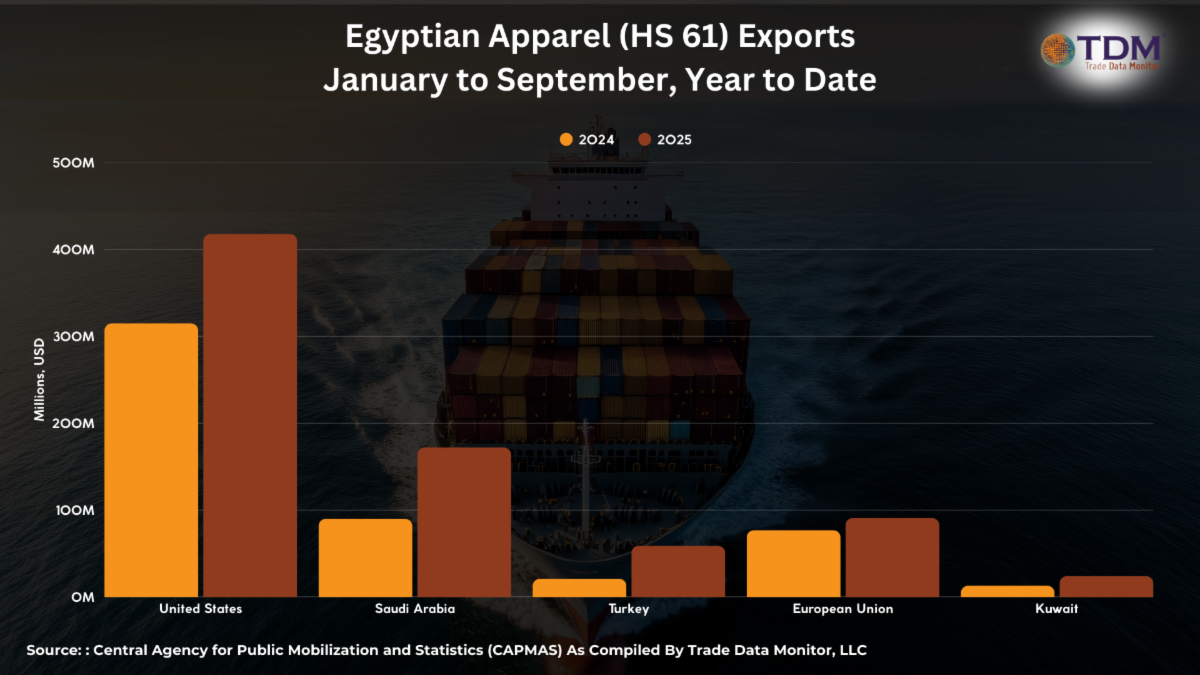
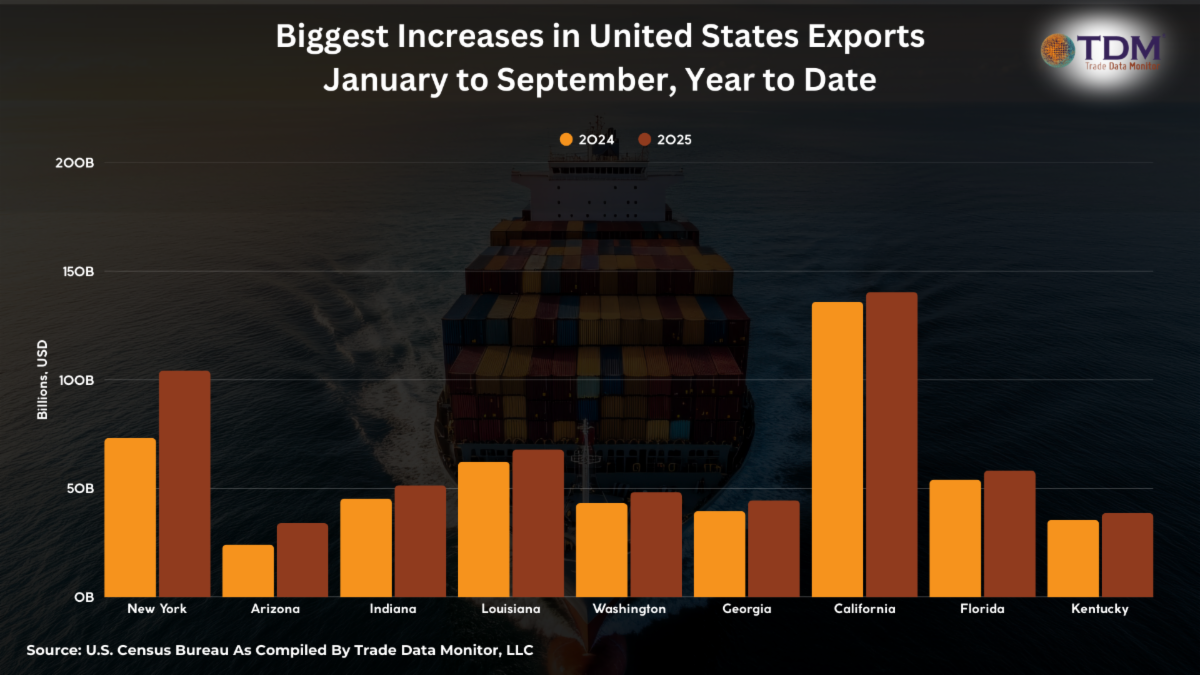
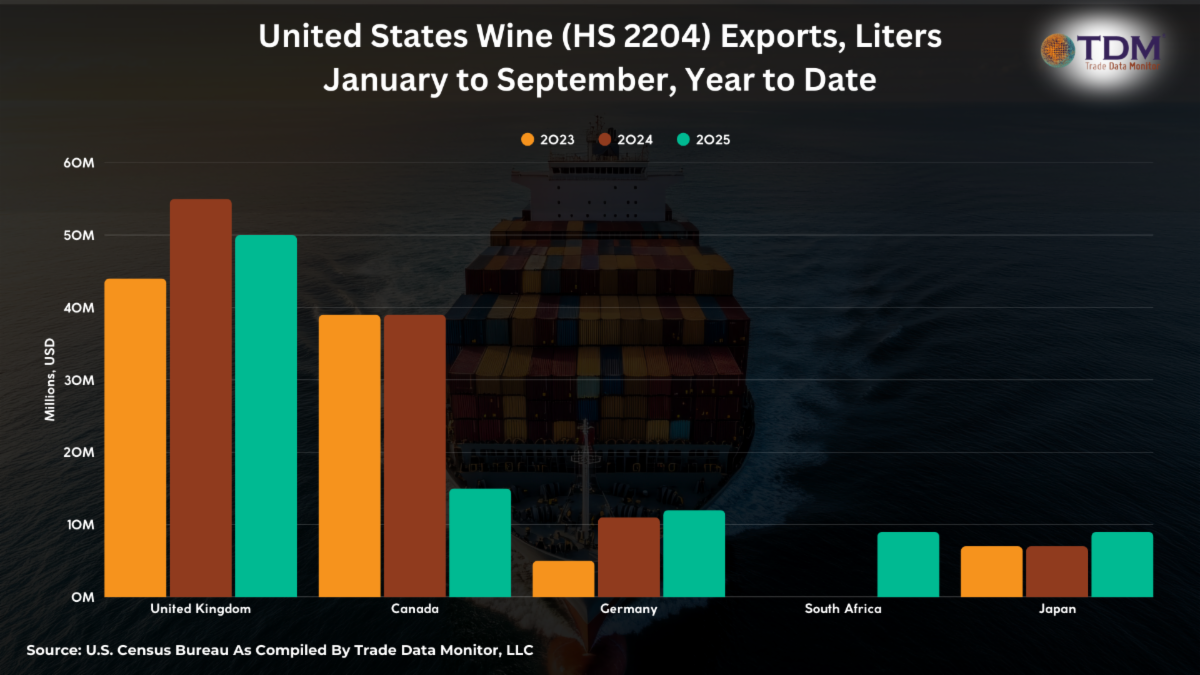
    8.   Trade Case Study: EgyptTrade coverage focuses on the big countries, but we’ve been studying smaller players, and one interesting case study is Egypt. It’s been boosting apparel exports, a sign of a country’s increasing prosperity and competitiveness on export markets. In 2025, Egypt clocked the biggest increase in apparel exports, shipping out $2.6 billion in the first nine months of 2025, 30.7% more than the year before. The second highest increase was registered by Cambodia at 16.9%, and no other country improved by double digits. 9.   What States’ Ports and Economies Are Thriving MostAmerica is a huge continental economy with dozens of distinct economic regions and sea- and airports. We sorted every state by increase year-on-year in exports from the place it’s leaving the U.S., over the first nine months of 2025. Texas and California are still the biggest exporters overall, but New York leads the race in year-on, because of its trade in physical gold. Arizona ranks second because of its electronics trade with Mexico. Third is Indiana, thanks to its exports of hormones to Italy. 10.   U.S. Wine ExportsA retaliatory tariff and a “Buy Canadian” movement have dented U.S. wine exports to its northern neighbor. Instead, U.S. producers are finding replacement markets in Germany, South Africa and Japan. 
    5 News Stories To Understand This Moment in Global Trade 📰
      
    WSJ: A Shrimper, a Carmaker, a Lawyer: How the World Tackled Trump’s Trade War: A fascinating mini-survey of how businesses around the world are being impacted by tariffs.Euronews: In 2025, global trade cracked as Europe hurt by US tariffs and new China shock: An important perspective, from Europe, on how trade flows have been rerouted toward the Old World. Global Trade: U.S. Tariffs to Cost Container Carriers $.2 billion by 2026, Alphaliner Warns: The U.S. isn’t just imposing tariffs on goods, it’s putting duties on ships. AP: Trump launched global tariff wars in 2025. Here’s a recap of his trade actions this year: A useful recap of U.S. trade duties in 2025. BBC: Peru’s ‘fast and furious’ blueberry boom: An optimistic story about global trade, chronicling how Peru has become the world’s biggest blueberry exporter.
    What We’re Reading 📚
      With tariffs still beating down optimism over global trade, it’s easy to get dragged down by the political story of modern commerce. What’s lost is the triumph of human ingenuity represented by the global logistics industry figuring out how to move goods from any place in the world to any other place. My former Wall Street Journalcolleague Christopher Mims tells that story in his 2021 book Arriving Today: From Factory to Front Door—Why Everything Has Changed About How and What We Buy. In an illustrative anecdote, Mims tells the story of a USB charger. After leaving a factory in Vietnam, Mims recounts, the charger “has traveled more than 14,000 miles, across 12 times zones, by truck, barge, crane, container ship, crane, and truck again, all before it trundled down a few hundred yards of conveyor, flitted about on the back of a robot, and was ferried again on, all told, miles more conveyor and at least two more trucks, before being hand-carried to someone’s front door.”

  • The Lessons of China’s First-Ever Trillion-Dollar Trade Surplus

    The Lessons of China’s First-Ever Trillion-Dollar Trade Surplus

    The Trillion-Dollar Surplus

    After falling year-on-year in October, China’s exports rebounded in November enough that it is almost certain that for 2025, the country that was mired in poverty when you and I were born will become the first nation ever to record a trillion-dollar trade surplus. 

    The number is just a number, but it’s a big one, and it’s sending shockwaves through boardrooms and national leadership offices across the globe. French president Emmanuel Macron has warned that Europe may have to follow the U.S. in enacting protectionist measures. 

    A Nice November (for China)

    For November, Chinese exports increased 5.9% year-on-year to $330.4 billion. That pushed up total exports for the year to $3.41 trillion. With overall imports at $2.34 trillion, the overall surplus sits at $1.07 trillion. It’s unlikely that China will run a trade deficit in December, meaning that the surplus will hold for full-year 2025. In 2024, China’s trade surplus came in just under a trillion dollars. 

    Overall, imports rose 1.9% in November to $218.7 billon. Imports from the U.S. declined 19% to $10.1 billon. Imports from the EU ticked up 1.7% to $22 billion.  Imports from Vietnam increased 9.8% to $8.8 billion. 

    How It Started

    How China got here is a well-chronicled tale. In the 1980s and 1990s, export-focused policies of communist party leadership and vast resources including a phenomenal domestic labor force and massive internal market attracted capital from across the globe and prompted allies to support China’s accession to the World Trade Organization in 2001. 

    In this decade, there’s been a protectionist reaction led by the U.S. that has sought to dent Chinese exports. By some measures, it’s succeeded. Chinese exports in November to the U.S. dropped 28.5% year-on-year to $33.8 billion. For some products, China seems on its way out as the world’s dominant supplier. In November, exports of garments, footwear and toys all fell by over 10% year-on-year. Even shipments of mobile phones, a mainstay of the Chinese manufacturing miracle, dropped 12.5% to $14.8 billion. 

    How It’s Going

    But what policymakers are now being forced to reckon with is that China’s export machine is so versatile and sprawling, with so many foreign markets, that it can easily adjust to the world’s largest economy trying to cut it off. 

    As exports to the U.S. have slowed, those to Europe have rebounded in 2025. Shipments to the European Union increased 14.9% in November to $47.1 billion. Exports to ASEAN nations increased 8.4% to $58.1 billion. Sales to Vietnam jumped 25.8% to $18.3 billon. Exports to Africa increased 27.7% to $20.9 billion. 

    China has also found new industries to dominate. Exports of motor vehicles in November rose 52.9% to $13.9 billion. Exports of ships increased 46.5% to $5.1 billion. As it’s built up its industrial manufacturing capacity, China has also been making its own market difficult to penetrate. Car imports dropped 41% in November to $1.9 billion. Sales of agricultural products rose 2.4% to $10 billion.  Shipments of fertilizers increased 40.2% to $1.4 billion. 

    How It Ends 

    With protectionist fervor only expected to increase, China’s leaders know they will have to adjust even more adroitly. The party leadership met on Monday, and President Xi Jinping counseled the stimulation of more domestic demand as “the main driver” for a “a strong domestic market.”

    In a note, Morgan Stanley said it expected a surflux of surpluses: “Given its dominant position in high-growth emerging sectors like EVs, batteries, and robotics, we believe China will continue to strengthen its position in global manufacturing and trade.”

    Already, it pays to be a commodity supplier to China. Imports of copper, iron ore, petroleum and natural gas all increased while purchases of coal continued to decline. Gas imports almost doubled, rising 95.6% to 11.9 million tons. One exception is rare earth, where imports fell 53.9% to 5,221 tons, and exports rose 24.4% to 5,494 tons. 

  • Chinese Exports Down 1.1% in October

    Chinese Exports Down 1.1% in October

    The Chinese export juggernaut finally started to show the impact of protectionism and weaker Western consumer markets in October. 

    A week after Presidents Trump and Xi settled a new trade deal that cut tariffs and put off their trade war for a year, China reported a 1.1% year-on-year drop in exports to $305.3 billion. 

    To be sure, this is only one month. China has shown resiliency thus far in 2025, finding other markets as Washington puts up obstacles to its exports. Shipments to the U.S. have declining since the spring. In October, exports to the U.S. fell 25.1% year-on-year to $34.9 billion. But sale to the European Union, especially Germany and France, had been holding steady. In October, surprisingly, they rose only 1%, to $43.9 billion.

    Analysts had predicted a 3% overall increase in exports, meaning that China missed its target by 4 percentage points. 

    Much of the recent analysis has focused on protectionist trade policies driven by populist politics. Although they have caused headaches for businesses by creating a climate of uncertainty, real tariffs have been lower than headline duties. Instead, a big part of the leveling off of Chinese exports has been caused by a change in its export composition, and in consumer demand in the U.S. and Europe. That’s why there’s been dramatic drops in shipments of consumer goods where China used to dominate. In October, for example, toy exports fell a whopping 31% to $2.5 billion. Shoe sales dropped 20.9% to $2.7 billion. Suitcase exports declined 25.7% to $2.1 billion. It’s not just the low-tech stuff. The number of mobile phones shipped dropped 14.2% to 70.6 million. Exports of high-tech products increased a modest 1.8% to $83 billion. 

    Meanwhile, China is dominating new markets, especially in the automotive sector. Car shipments boomed again in October, rising 34.1% year-on-year to $14.3 billion. In Europe and the U.S., China still has to contend with strong domestic manufacturers. These exports tend to go elsewhere. China’s top 10 car markets so far this year: UAE, Russia, Belgium, UK, Mexico, Australia, Brazil, Saudi Arabia, Spain, Kazakhstan.  

    The bright spots: In October, shipments to ASEAN nations rose 11.1% to $53.3 billon; exports to Vietnam increased 22.4% to $16.6 billion. Exports to Africa rose 9.4% to $17.7 billion. Exports to Latin America increased 2.2% to $24.1 billion. Exports to Russia, however, plummeted 22.5% to $8.5 billion. 

    The slowdown in trade poses a challenge for Chinese policymakers. “As exports rapidly lose steam and retail sales show signs of deterioration, we see increasing pressure on Beijing to step up policy support to stabilize growth” until the end of 2025, Nomura wrote in a note.

    Domestically, there are certainly questions. 

    In October, imports rose only 1% to $215.3 billion, raising questions about domestic demand. Imports of agricultural products rose 7.1% to $17.2 billion. Purchases of high-tech products rose by 3.1% to $69.9 billion. 

    Imports from the U.S. declined 22.5% to $10.2 billion. Imports from the EU rose 4% to $22.1 billion. Imports from ASEAN countries fell 4.6% to $32.5 billion. Purchases from Africa increased 5.4% to $9.7 billion. Imports from Latin America, goosed by soybean sales, were up 15.1% to $21.5 billion. Imports from Russia rose 0.9% to $11 billion. 

    Beijing has reported GDP growth of 5.2% over the first nine months of the year, and seems on track to hit the government’s 5% goal for the year. 

    One good sign is the country’s appetite for industrial commodities: Imports of copper and iron ore rose year-on-year in October, as did purchases of natural gas and crude oil. Imports of coal continued to fall sharply.

  • Is Global Trade Too Strong for Tariffs?

    Is Global Trade Too Strong for Tariffs?

    Global Trade Can Take a Punch

    This month, markets have swerved to adjust to the threat of new U.S. tariffs on Chinese imports. Yet, global trade keeps finding a way. In September, although shipments to the U.S. plummeted, China’s monthly exports increased 8.3% year-on-year to $328.6 billion.

    One way of looking at the stubborn performance of China’s export machine, and the global trading system, is that the swift emergence of an infrastructure that can function without the U.S.. “This resilience shows that China has strengthened trade with the rest of the world amid US protectionism,” ING Bank economist Lynn Song wrote in a published note Monday.

    To be sure, both China and the U.S have talked up the possibility of more radical constrictions on trade that would put more of a dent in the global economy, but so far this year, trade has been surprisingly robust. 

    The Supereconomies

    At the World Trade Organization’s forum last month, there was talk of how a multilateral trade deal might be conceived even if Washington didn’t join the party. But, despite new duties, even the U.S. is having a decent year trading with the rest of the world. In the first seven months of 2025, U.S. imports increased 11% to $2.1 trillion, while exports rose 4.6% to $1.2 trillion. 

    What’s going on here? 

    The simplest explanation is that the world’s two supereconomies are both so populated and wealthy that businesses can find opportunities to buy and sell despite governments’ new tax burdens. 

    To boot, China and the U.S. are less and less intertwined with each other, meaning that their trade dispute has less of an impact on the global economy that it would have a decade ago. 

    Ten years ago, in the first nine months of 2015, the U.S. accounted for 18%, or $303.8 billion, of China’s $1.7 trillion of exports. This year, in the first nine months of 2025, the U.S. was worth only 11.4%, or $317.2 billion, of China’s $2.8 trillion of exports. In September, exports to the U.S. dropped 27% to $34.3 billion. 

    The World is a Big Place

    To replace the U.S. markets, Chinese-based manufacturers, many of which are connected to U.S. and European corporations, have been finding substitute markets. In September, Exports to ASEAN countries increased 15.8% to $53.7 billion. Particularly, exports to Vietnam rose 24.6% to $16.7 billion. Exports to the European Union rose 14.2% to $48 billion. 

    One place that is becoming less valuable to Chinese exports: Russia, where exports dropped 21% to $8.9 billion.

    China’s economy has faced its own set of challenges, including a credit crisis and housing bubble. But in September, total imports increased 7.4% to $238.1 billion, despite imports from the U.S. falling 16.1% to $11.5 billion. Imports from the EU rose 9.5% to $25.2 billion, compensating for imports from ASEAN nations slipping 0.8% to $36.5 billion. 

    The Strength of Heavy Industry 

    The real reason for the boost in imports is an increase in purchases of industrial commodities. Imports of copper increased 6.4% to 2.6 million tons. Iron ore purchases rose 11.9% to 116.3 million tons. These came from commodity-rich nations in Africa and Latin America. Imports from Africa increased 22.5% to $10.6 billion, and purchases from Latin America rose 18.6% to $23.3 billion. China has been reducing its intake of fossil fuels. Coal imports in September fell 3.3% to 46 million tons. 

    All that metal is getting turned into a car industry that have overtaken the U.S. In September, automobile exports increased 10.8% to $12.8 billion. 

    In many cases, companies are overcoming protectionism for a simple reason: They can afford it. For example, in September, China’s exports of rare earths declined 4.3% by quantity, to 4,000.3 tons. By prices, they roughly doubled in value to $60 million. It’s often said that rare earths are essential for modern electronics, and that’s true, but the quantities required are miniscule, and even when supply gets tightened and prices spike, affordable.  

    There are real signs that tariffs and faltering consumer demand are denting exports of manufacturing staples. Exports of toys, for example, fell 28% to $2.9 billion. Sales of shoes fell 13.2% to $2.9 billion. Exports of household appliances dropped 9.6% to $7.7 billion. 

    One good sign for global trade: exports of ships increased 24% to 543 from 438. By value, sales rose 43% to $6.6 billion. Ships are becoming more valuable because firms need them.

  • Casualties of the U.S.-China Trade War: 36 Million Phones

    Casualties of the U.S.-China Trade War: 36 Million Phones

    Please Dial a New Number 

    As U.S. and Chinese negotiators try to find a way out of tariff gridlock, one thing is certain: The smartphone supply chain has shifted significantly, upending the practices and expectations of manufacturers, logistics firms, and retailers.  

    China’s exports of mobile phone fell 11.6% year-on-year in August to 60.8 million sets. In dollar terms, they declined 18.9% to $6.8 billion. For the first eight months of 2025, Chinese exports of mobile phones dropped 11.5% to $64.1 billion. The number of sets shipped shrank 7.2% to 462.5 million. 

    That’s 36 million fewer phones. 

    It’s no mystery where the capacity has shifted. In the first seven months of 2025, the U.S. has boosted smartphone imports 201.7% from India to $13.2 billion, and 170.9% from Vietnam to $3.5 billion. 

    Chinese Export Growth Slows

    Overall, total Chinese exports rose 4.4% in August to $321.8 billion, below a forecast around 5% and after increasing 7.2% in July. Shipments to the U.S. fell 33.1% to $31.6 billion. Washington currently has tariffs of around 55% on most Chinese exports, while Beijing has duties of around 30% on U.S. goods. Trade diplomats from each country have given themselves two more months to negotiate. 

    Meanwhile, China has been increasing exports elsewhere. Exports to the European Union rose 10.4% in August to $51.7 billion. Shipments to ASEAN nations rose 22.8% to $57.1 billion. Exports to Vietnam increased 31.2% to $17.6 billion. Sales to Africa increased 26% to $18.6 billion. Shipments to India increased 9.2% to $12.5 billion. 

    To be sure, there’s only so much more those countries can absorb, and analysts expect exports to level off. “With the temporary boost from the U.S.-China trade truce fading and the U.S. raising tariffs on shipments rerouted via other countries, exports are likely to come under pressure in the near term,” Zichun Huang, China of Capital Economics wrote in a note. The U.S. has been concerned about transshipment and is implementing penalties for goods it believes originate in China.

    One country already buying less from China is Russia. Chinese exports to the warring nation fell 16.6% to $8.5 billion. So far this year, exports to Russia have fallen 9.7% to $64.8 billion. 

    Buying More Soybeans

    The U.S. has been pushing China to buy more soybeans. In August, soybean imports increased 1.1% by quantity to 12.3 million tons, but fell 8.6% by value to $5.5 billion. Imports of agricultural products declined 2.9% in August to $18.7 billion. Grain exports increased 7.1% to 217,816 tons but because of falling prices fell 11% by dollar value to $102 million. Overall, exports of agricultural products fell 3.8% to $8.1 billion.

    Rare Earth Exports Rise 

    Washington has also been lobbying for easier trade in rare earths minerals. Exports of rare earths increased 34.6% in August to $55 million. By quantity, they increased 22.6% to 5.791.8 tons. Exports of high-tech products increased 9% to $79.3 billion. Sales of China’s manufacturing staples continued their long, slow fall. Exports of footwear declined 17.1% to $3.3 billion, sales of toys fell 20.9% to $3.2 billion, and shipments of household appliances dropped 6.6% to $8.4 billion. 

    China’s Long-Term Cut in Imports

    Total Chinese imports increased 1.3% to $219.5 billion, as the country stabilizes as more of a self-sustaining market. Imports were down 6% from $233.4 billion in August 2022. In the first seven months of 2025, China reduced imports 2.2% to $1.7 trillion. 

    China is buying less from all its trading partners. In August, imports from the European Union fell 1.8% to $22.8 billion, purchases from the U.S. declined 15.8% to $11.3 billion, and shipments from ASEAN countries fell 3.8% to $32.8 billion. Imports from Africa declined 6.9% to $9.6 billion. Imports from Russia dropped 18.7% to $9.4 billion. 

    There were some exceptions: Imports from Vietnam rose 4.6% to $8.9 billion, and purchases from India rose 16.2% to $1.5 billion, a relatively small number. Imports of high-tech products rose 3.5% to $67.3 billion. 

    To be sure, even as it buys more of what it produces, China still needs raw materials. Imports of copper ore and concentrates increased 7.4% to 2.8 million tons. However, China continued to cut its coal imports: Purchases of the black rock dropped 6.7% to 42.7 million tons.

  • Global Coal Trade is Finally Faltering

    Global Coal Trade is Finally Faltering

    China Cuts Coal Imports

    For years, as governments around the world embraced clean energy technology, coal trade held steady because China was still buying. As the rest of the world turned away from coal, China boosted imports to power its booming electrification, and a vibrant new industry of electric vehicles and batteries. In 2024, it imported 352.2 million metric tons of coal, up 79% from 197 million in 2019. 

    This year, China is finally giving up the rock. In July, its purchases of coal dropped 22.9% year-on-year by volume to 35.6 million tons, while boosting imports of other energy sources. Imports of natural gas rose 82.4% to 10.6 million tons, and imports of crude petroleum oil increased 11.5% to 47.2 million tons.

    China diminished imports from its top sources: Russia, Australia, Mongolia and Indonesia. The only country it increased coal imports from was Canada, boosting imports 13.3% to 5.4 million tons. 

    So what is going on? China has been producing more coal domestically and also developing more alternative energy sources such as wind and solar. It’s also transforming its economy to become less dependent on global trade, by ramping up production in assets like coal, where it has abundant resources. Exports of fertilizers rose 134.5% to $2.1 billion, and exports of agricultural products increased 1.6% to $8.4 billion.

    Adjusting to U.S. Tariffs

    The switch is just one of the ways China has been adjusting to duties from its biggest export market. How the world adapts to a newly protectionist U.S. is one of the most important economic stories of the decade. On Thursday, August, 7, Washington slapped duties from 10% to 41% on hundreds of billions worth of imports from dozens of countries. 

    Also on Thursday, China said its overall goods exports increased 7.2% in July to $321.8 billion, surpassing the expectations of analysts who’d predicted growth of around 6%. Exports to the U.S., however, fell 21.6% to $35.8 billion, while imports from the U.S. shrank 18.6% to $12.1 billion. 

    Current U.S. tariffs on Chinese imports vary, but are generally around 45%. The U.S. has also eliminated the de minimis exemption, which allowed companies to ship goods worth under $800 into the U.S. tariff free. 

    Negotiators from Washington and Beijing are currently negotiating a new agreement governing tariffs between the two countries. The two sides have set an August 12 deadline, after which they’ve threatened to impose duties of over 100%, which would cripple trade between the world’s dominant trading economies.

    Destination Europe

    One surprising development has been how much China has managed to redirect its exports into the European Union. Officials from Brussels visited Beijing last month. Shipments into the EU increased 9.3% in July to $50 billion, even as imports from the EU declined 1.4% to 24.5 billion. 

    Less surprisingly, exports to ASEAN nations rose 16.8% to $54.6 billion, led by shipments to Vietnam increased 28.1% to $17.1 billion. Imports from ASEAN nations fell 5.4% to $31.4 billion. Exports to Russia continued their decline, falling 9% to $9.1 billion. 

    Supply Chains or Domestic Demand?

    China’s total imports rose 4.1% in July to $223.5 billion. The increase in imports was driven by increases in commodity shipments from Africa, up 20.3% to $10.6 billion, Latin America, up 12% to $22.1 billion, and India, 26.4% to $1.7 billion. 

    Just as the new American dream appears to be a self-contained continental market, so it goes for China. It’s now a country that makes everything. All it needs is raw materials. Imports of agricultural products rose 5.4% to $18.7 billion. One essential question is how much the trade is focused on supplying the domestic market, and how much is part of global manufacturing supply chains. 

    Phone and Cars

    Shipments of high-tech products rose 4.3% to $78.1 billion. Exports of mobile phones, however, fell 21.8% to $7.5 billion, signaling that China could losing one of the mainstays of its export economy. In the first half of 2025, the U.S. cut smartphone imports from China 27.6% to $11.2 billion from tripling them from India to $11.6 billion. That might change as President Trump moves to slap duties on India. Imports of high-tech products rose 7.9% to $71.9 billion, and exports of chips and integrated circuits increased 29.4% to $17.9 billion. 

    When it comes to cars, China has already become a country that makes way more than it takes. Exports of motor vehicles rose 18.5% to $11.8 billion. Imports of motor vehicles dropped 42.1% to $2.5 billion. 

    Toy sales fell 3.2% to $3.5 billion. 

  • Chinese Exports to U.S. Plunge Along With Smartphone Shipments

    Chinese Exports to U.S. Plunge Along With Smartphone Shipments

    First Impact of U.S. Tariffs

    Chinese shipments to the U.S. plummeted 21% year-on-year in April as the impact of Washington’s new import tariffs started to punish the world’s largest exporter.

    However, as Beijing was quick to point out, China compensated by selling more to its economic partners in Southeast Asia. In a striking coincidence, Chinese exports to the ASEAN bloc of countries increased by the same number: +21%.

    The decline in shipments to the U.S. is the first time that China has reported a significant harmful impact of the tariffs. In the first quarter, exports to the U.S. continued their rise as manufacturers and shipping companies rushed goods into ports before the expected duties took effect.

    Eager to temper the market’s worries about a severing of the trade relationship between the world’s top two economies, diplomats are meeting in Switzerland in an attempt to secure a new agreement about trade terms. The outcome is certain to be higher tariffs than a decade ago, but officials are wary of triggering a recession. 

     Focus: U.S.

    The focus of the April data release was, of course, shipments to the U.S. Exports to the U.S. plummeted 21% to $33 billion. The preliminary data form does not break out exports per individual country. But the biggest drop in exports among significant consumer goods was in mobile phones: Shipments dropped 20.9% to $7.6 billion. The number of handsets shipped fell 5.8% to 56.1 million. However, overall of high-tech goods rose 6.9% to $74.7 billion.

    Overall exports of toys declined 5.9% to $2.9 billion. Exports of textiles rose 3.4% to $12.6 billion. Exports of mechanical and electrical products jumped 10.5% to $190.6 billion. 

     The Asian Solution

    Overall, China’s exports to the rest of the world increased 8.1% to $315.7 billion, raising the country’s hopes that its mighty export economy can survive an onslaught of protectionism. The U.S. currently has tariffs of 145% on Chinese imports.

    Where will all this excess capacity no longer going to U.S. markets be going?  Exports to ASEAN countries rose 21% to $60.4 billion. Imports increased 3.5% to $33.2 billion. The biggest jump was in shipments to Indonesia, which rose 37.5% to $7.8 billion. Exports to Vietnam increased 23% to $17.2 billion. Sales to Thailand rose 28.1% to $9.3 billion.

    Lu Daliang, a Chinese government spokesman, said that “all-round co-operation with neighboring countries continued to deepen and economic and trade relations became increasingly close.”

     Rest of the World

    It’s not just Asia. There are many other markets targeted by companies manufacturing in China, many of which are not Chinese. Exports to Africa ballooned 25.9% to $18 billion. Imports from Africa increased 22.3% to $12.4 billion. Exports to the European Union increased 8.2% to $46.7 billion. Among EU customers, there was a big jump in exports to Germany, up 20.4% to $10.4 billon. Another important market: India. Exports to that country rose 21.9% to $11.2 billion.

    What China is Buying

    China’s overall imports in April slipped 0.2% year-on-year to $219.5 billion. There are concerns that China’s domestic spending has been lackluster. Chinese officials have set an economic growth target of around 5%. This week, policymakers said they would cut interest rates and inject more money into the economy.

    China has imposed retaliatory tariffs of 125% on imports of U.S. goods. Imports from the U.S. dropped 13.6% in April to $12.6 billion. The upshot: the trade surplus with America finally fell, a key strategic objective for U.S. leaders, to $20.5 billion from $27.3 billion.  

    Clearly a big part of the cut in U.S. imports was agricultural products. Purchases of soybeans fell 38.2% to $2.7 billion. Imports of grains fell 41.1% to $3.7 billion. Imports from the EU declined 16.5% to $20 billion. Imports from Germany fell 12% to $7.6 billion.

    Some products with changing demand in China: Imports of high-tech products increased 9.8% to $67.6 billion. Imports of pharmaceuticals declined 11.2% to $4.1 billion.

    Getting Ready for the Storm

    The U.S. has allowed a 90-day pause in application of tariffs of other countries. That’s why it’s significant that Chinese exports of steel increased 13.4% to 10.5 million tons. Buyers in countries like South Korea and Vietnam are snapping up metal so they can sell to the U.S. and EU before more aggressive tariffs take effect. 

  • Tech Sector Resilient as Chinese Imports Fall Steeply

    Tech Sector Resilient as Chinese Imports Fall Steeply

    Rocky Waters

    It’s a perilous time for the global trading system. President Trump has imposed an across-the-board tariff of 20%, in two tranches of 10%, on U.S. imports of Chinese goods. There are threats of more action, on microchips, drugs, and automobiles. Lesser degrees of protectionism in Europe, Canada and elsewhere are also denting confidence in trade. In China, internal consumer demand has been tepid for some time. Officials from both countries are ratcheting up rhetoric. “China’s determination to safeguard its own interests is unwavering,” said Wang Wentao, China’s commerce minister, this week. “The two sides can meet at the appropriate time and can also communicate as soon as possible.”

    China’s trade results in the first two months of 2025 offer little comfort overall. Exports rose only 2.3% to $539.9 billion, and imports fell 8.4% to $369.4 billion, as China’s considerable trade surplus widened. China always reports trade data from the first two months of the year combined in order to blunt the volatility created by the Chinese New Year. In this case, it couldn’t deflect the news. Analysts had expected better.

    Silver Lining: Tech

    There was, however, a silver lining in the tech sector. An artificial intelligence revolution is goosing investment and launching new supply chains. It’s an exciting time in many ways. There may be protectionism coming for high-tech, but for now, it’s boosting global trade.  China’s shipment of high-tech goods bumped up 5.4% $131.9 billion. Exports of integrated circuits rose 11.9% to $25.1 billion. Imports of high-tech products increased 6.4% to $109.5 billion. Imports of many industrial commodities declined during the first two months of 2025. Imports of iron ore dropped 30% to $19 billon. Imports of coal are finally stagnating by quantity and declined 18.5% by value to $6.5 billion. However, purchases of copper, which is used for high-tech wiring, were the exception. They increased 5.6% to $11.4 billion.

    The consolidation of the global economy into Asian, European and American poles continues. Exports to ASEAN countries increased 5.7% to $87.2 billion, while shipments to the European Union nudged up only 0.6% to $79 billion. Exports to the U.S. increased 2.3% to $75.6 billion. Sales to Singapore dropped 13.8% to $9.8 billion. Shipments to Russia, which had soared since Russia’s invasion of Ukraine in 2022, dropped 10.9% to $15 billion. Imports from the U.S. rose 2.7% to $26.5 billion. Shipments from the EU declined 5.6% to $36.9 billion. Even imports from ASEAN nations fell 1.3% to $56.6 billion. Imports from Russia declined 3.9% to $19.7 billon. 

    The Demand Dilemma

    The Chinese export economy has been suffering from a variety of global trends. The Western appetite for low-cost consumer goods seems to be diminishing. Shipments of toys plummeted 11.1% to $5 billion. Exports of luggage sank 20.2% to $4.5 billion. Other sectors have been tepid. Exports of agricultural products, for example, rose only 3% to $15.2 billion. Shipments of automobiles, which had been booming, rose 2.5% to $16.1 billion. Prices appear to be falling. China shipped out 971,000 cars in January and February, a 16.8% rise by quantity. The rare earths market, which politicians, most lately in the U.S., love to talk about, is tiny. How tiny? Exports of rare earths decreased 0.4% to $82 million. 

    Consumer demand in China continues to challenge policymakers. Imports of automobiles fell 50.3% to $3 billion. Purchases of pharmaceuticals dropped 10.8% to $6.6 billion. “It’s likely that imports will remain soft this year unless we see a stronger than anticipated rebound of consumption and private investment this year,” according to Lynn Song, an economist at ING. The leadership in China has been focused on trying to improve economic growth. On Wednesday, Li Qiang, China’s premier, said that domestic demand was “weak”. For 2025, he announced an economic growth target of 5%.

    John W. Miller

  • Record Chinese Global Surplus Neared $1 Trillion in 2024

    Record Chinese Global Surplus Neared $1 Trillion in 2024

    The Trillion-Dollar Surplus

    In 2024, China recorded the biggest global trade surplus in economic history at $992 billion, according to preliminary data released Monday by Beijing. The gap, beating the previous record of $838 billion in 2022, is almost certainly unsustainable. Amid worsening relations with the U.S., Europe and Canada, it may never pass the trillion-dollar mark. But it’s important to parse the data and grasp the nuances in Chinese trade. Not all trade relationships are created equal.

    One macroeconomic fact is undeniable. China’s trade surplus is a colossus, representing a history-making investment by Western companies and countries this century into making goods in China at low costs for export to markets around the world. For the year, Chinese exports increased 5.9% from 2023 to $3.6 trillion. Imports rose 1.1% to $2.6 trillion.

    In Beijing on Monday, as they presented their results, including the near-trillion-dollar surplus, trade officials crowed about their affirmation of China as the world’s dominant exporter. China “has consolidated its status as the world’s largest merchandise exporter,” Wang Lingjun, a senior customs official, told reporters in Beijing.

    Problems With the Surplus

    But that narrative leaves out some key facts. One is that businesses have been hustling to get Chinese goods across borders before fresh tariffs hit in 2025, artificially goosing exports. Another is that China has become a depressed consumer market, which too many goods chasing not enough customers, forcing prices to drop. That said, in certain niche sectors, especially automobiles and integrated circuits used in artificial intelligence, China’s manufacturing is set to be a big buyer and seller for years to come. Exports of high-tech products increased 4.4% year-on-year to $80.3 billion in December.

    Buy Before Close

    With President Donald Trump’s inauguration looming on Jan. 20, there has certainly been an incentive to load up on Made in China-goods. Trump has threatened to slap 60% import tariffs on Chinese imports. In December, total Chinese exports rose 10.7% year-on-year to $335.6 billion. Sales to the U.S. increased 15.7% year-on-year to $48.8 billion. Exports to the European Union rose 8.8% year-on-year to $46.5 billion. Only a few regions notched diminished exports. Shipments to Australia fell 11.8% to $5.7 billion. The two powers have been locked in a tense trade relationship for years, but some export restrictions were lifted this year.

    Selling Cars to Brazil and Ships to Everybody

    For the year, the biggest increase in market share was Brazil, which has been gobbling up Chinese electronics and cars. Exports to the South American power rose 22% to $72.1 billion. The biggest decline was sales to the Netherlands, which fell 9% to $91.2 billion. The European port country has slashed imports of an array of Chinese goods such as machinery, toys and cars. China has been leading the world’s electric vehicle boom. The country shipped out 6.4 million cars in 2024, a 22.8% increase from 2023. The value of all those vehicles: $117.4 billion, up 15.5%. But now it’s facing tariffs from the EU, Canada, and the U.S. It’s not just with the U.S. that China has a difficult trade relationship. The EU has imposed tariffs as high as 45% on imports of Chinese electric vehicles. Beijing has retaliated with duties on brandy and other European exports. But it’s clear that China has more to lose in the battle. Another market that dropped: South Africa. Exports there dropped 7.8% to $21.8 billion. One sector that keeps growing and points to an optimistic scenario for global trade is the increase in Chinese exports of ships.  For the year, exports of ships rose 25.1% to 5,804. By value, they increased 57.3% to$ 43.4 billon.

    The Problem With Demand 

    Chinese officials are still struggling to boost their own domestic economy, which has been threatened by a real estate slump, among other things. For the year, Chinese agricultural imports shrank 7.9% to $215.2 billion. But even in sectors with good volumes, it’s hard to make money, because prices have been falling. Imports of soybeans, for example, rose 6.5% to 105 million tons, although they declined by value, dropping 10.9% to $52.8 billion. The country with the largest increase in imports into China in 2024 was South Korea. Chinese purchases from the Asian neighbor rose 12.4% to $181.7 billion. The biggest drop in imports was from Germany, which declined 10.7% to $94.8 billion. To be sure, Germany is only China’s 10th largest source of imports, after (in order) Taiwan, South Korea, the U.S., Japan, Australia, Russia, Brazil, Malaysia and Vietnam. China’s trade habits have been disappointing to a lot of German exporters, but not to Asian tech firms. Overall high-tech imports in 2024 rose 10.7% to $753 billion, and shipments from the ASEAN group of Asian neighbors increased 2% to $395.8 billion.

    John W. Miller

  • Chinese Demand Falters as Imports Decline

    Chinese Demand Falters as Imports Decline

    Trade in a Time of Geopolitical Adjustment

    The focus of the global trade world is, rightly, on President-elect Donald Trump and the U.S. debating and deciding how far they’ll go in enacting new protectionist measures.

    But an issue that could upend geopolitics — with unintended consequences that will affect big issues like war and peace, migration, and supply chains — just as much is what appears to be a crumbling in Chinese domestic demand. 

    In a time of geopolitical shifting and adjustments, it’s one of the key factors to watch. In the first six months of 2024, according to TDM, China was the world’s second largest importer, shipping in $1.3 trillion worth of goods, behind only the U.S. at $1.6 trillion, and followed by Germany, the Netherlands, and the UK. (France, Japan, India, South Korea and Italy round out the top ten.)

    In November, total Chinese imports fell 3.9% to $214.9 billion from $223.6 billion a year ago.

    What Will Happen to Chinese Demand?

    Almost certainly knowing these numbers were coming, Beijing on Monday said it would unroll an “appropriately loose” monetary policy in 2025. That would be its first unwinding in almost 15 years. The goal will be to increase demand domestically and goose consumer consumption, according to government officials. Beijing also plans to give more subsidies, and even hand out consumer vouchers. China would embrace “the principle of pursuing progress while maintaining stability,” state news agency Xinhua said.

    The declines spanned the globe. Imports from the EU fell 6.5% to $21.7 billion. Imports from the U.S. dropped 11.3% to $12.4 billion. Imports from ASEAN countries declined 2.5% to $33.6 billion.

    In November, imports of agricultural products fell 15% year-on-year to $15.8 billion. Purchases of grain fell 35.7% to $4.3 billion. Imports of motor vehicles plummeted 28.9% to $3.3 billion. China’s preliminary monthly trade report doesn’t break out consumer goods in much detail, but some products offer hints of consumer confidence.  Imports of cosmetics and clean-care products, for example, dropped 8.3% to $1.2 billion.

    Et Tu, Electronics?

    One sector of global trade that had expected to survive the coming choppy waters is consumer electronics. There will surely be more curbs like those enacted by the U.S. on sales of chips, but in general the supply chains needed to produce iPhones and laptops is meant to endure. But here, too, there are signs of weakening. In November, Chinese imports of high-tech products rose only 2.6% to $64.7 billion. Imports of copper ore and concentrates, a key ingredient in making electronics, fell 8.1% to 2.2 million tons. 

    The Rest of the World

    China’s export picture was a little better in November, although there was still some softening, because of new tariffs and sluggish demand. Shipments of agricultural products rose 7.4% to $9.8 billion. Exports of high-tech products increased 6.5% to $81.8 billion. Exports of toys rose 4.9% to $3.1 billion. Some of these shipments were ordered over the summer as it became clear that Trump might win a second term to the White House. We’re likely to see a lot more of that in December and January, say analysts. 

    Total Chinese exports increased 6.7% year-on-year to $312.3 billion in November 2024 from $292.6 billion the year before. The forecast by analysts had been around 8.5%, and that was a drop from a 12.7% increase in October. Exports to the European Union rose 6.7% to $41.1 billion. Exports to ASEAN countries rose 14.7% to $53.7 billion. Exports to the U.S. rose 7.3% to $47.3 billion. Exports to Vietnam rose 12.3% to $14.5 billion.

    To be sure, factories in China have been affected by general sluggish in consumer confidence around the world. Sales of shoes dropped 1.9% to $3.8 billion. Exports of mobile phones slipped 0.3% to $16.9 billion. Even exports of motor vehicles, a staple of Chinese export success, dropped 7.7% to $9.1 billion. The U.S., EU, and Canada have all slapped duties on imports of Chinese electric vehicles. 

    John W. Miller

  • Trump Election Gooses Trade– Before Tariffs Hit

    Trump Election Gooses Trade– Before Tariffs Hit

    This week’s election of Donald Trump as the U.S.’s 47th president is almost certainly likely to lead to another trade war with China, and further tariffs on American imports. During the campaign, Trump said his favorite word was tariff and floated a universal 10% tariff and specific duties on Chinese imports as high as 60%.

    If applied, the levies would jack up average tariffs to 17.7%, America’s highest rate since 1934, during the Great Depression, according to the Tax Foundation, representing a sharp turn toward deglobalization, and a potential deflation of China’s powerful export economy. 

    The affirmation of Trump’s election this week will accelerate a trend international manufacturers and purchasers worried about the risk of tariffs have already set in motion—increased exports, especially from China to the U.S. and Europe, before the tariffs hit sometime during the course of next year.

    In October, China increased its overall outbound shipments a whopping 12.7% year-on-year to $309.1 billion, their briskest pace in more than two years. At the same time, imports declined 2.3% to $213.3 billion. The lackluster import figures point to potential weaknesses China’s domestic economy.

    That makes taking advantage of current trade terms with the U.S., China’s number one export market, even more urgent. Exports to the U.S. increased 8.1% in October to $46.7 billion. Interestingly, imports from the U.S. grew 6.6% to $13.2 billion, making it one of the only regions to increase exports to China in October. Beijing is almost certain to retaliate next year with tariffs on U.S. imports, kicking off a new, heightened trade war. “Trump’s return could create a short-term boost to Chinese exports as U.S. importers increase their purchases to get ahead of tariffs,” wrote Zichun Huang of Capital Economics in a research note.

    The U.S., of course, is not the only economic power ramping up protectionism. This year, the European Union and Canada also imposed tariffs on imports of Chinese electric vehicles. Officials in those jurisdictions are expected to further hike duties, heightening the urgency of making shipments. Exports to the European Union rose 12.6% to $43.5 billion, while imports from the EU fell 6.1% to $21.3 billion. Overall, China exports around a trillion dollars of goods annually, roughly 30% of its overall exports, to the U.S. and Europe. 

    In October, Chinese exports rose across the board for all kinds of goods. Shipments of agricultural products rose 11% to $9.2 billion. Sales of high-tech products increased 9.3% to $81.6 billion. Exports of toys rose 4.1% to $3.7 billion. Exports of motor vehicles grew 4% to $10.7 billion. A couple exceptions: shipments of mobile phones declined 0.4% to $18.6 billion, and sales of footwear fell 1.1% to $3.4 billion.

    With trading partner after trading partner, China ramped up its trade surplus. Exports to ASEAN nations, which are part of a new Asian supply chain network, increased 16.2% to $48 billion, while imports fell 7% to $34 billion. Exports to Africa increased 21.1% to $16 billion, while imports shrank 8.2% to $9.2 billion. Exports to Russia increased 26.7% to $11 billon, part of an integration of the two massive economies since Russia invaded Ukraine. Imports, however, fell 3.9% to $10.8 billion. Exports to Latin America increased 23.1% to $23.6 billion, while imports fell 10.4% to $18.6 billion

    Imports of ag products fell 4.9% to $16 billion. Shipments to China of high-tech products rose 9.1% to $67.9 billion. Imports of natural gas rose 27.1% to $5.4 billion. Imports of coal rose 14.4% to $4.1 billion. 

    This week, Beijing is set to announce a new package of stimulus measures. One sign it might need it: It is the world’s number one energy importer, and in October Imports of oil dropped 25.3% year-on-year to $24.3 billion by value and 8.7% by quantity to 44.7 million tons.

    John W. Miller

  • China Finally Affected by Protectionist Tariffs

    China Finally Affected by Protectionist Tariffs

    September Rain

    China posted lackluster trade figures in September, highlighting how it might become slowly less reliant on global commerce as other major economies retrench.

    Chinese exports increased 2.4% year-on-year, below economists’ expectations of around 6%, to $303.7 billion, while imports increased only 0.3% to $222 billon.

    The 2024 Boom

    For most of 2024, Chinese exports and imports have been among the world’s best performing, despite aggressive protectionist tariff actions by U.S. and European governments. In August, for example, Chinese exports rose 8.7% year-on-year. Modern China, the greatest exporting power the world’s ever known, wasn’t going down so easily.

    That changed in September. “After the stellar run in 2024, China’s exports finally face a wake-up call from global trade protectionism and overcapacity, affecting sales quantity and unit value,” Gary Ng, a senior economist at French investment bank Natixis, told the South China Morning Post. “The weaker import data shows domestic demand has not recovered with cautious household and business sentiments regarding consumption and investment.” Chinese customs officials also pointed to typhoons in Asian ports, congestion in the shipping industry and the high trade volumes of previous years.

    EU Slump

    The bigger picture, however, is more complex. In particular, China’s September data point to a loosening of ties with the European Union. Shipments to the EU rose 1.9% to $42.1 billon while imports fell 3.2% to $23 billon. Imports from France fell 11.1% to $2.9 billion.  Shipments from Italy declined 7.8% to $2 billion.

    By comparison, exports to the U.S. rose 2.9% to $47 billion, while shipments from the U.S. rose 6.6% to $13.7 billion. Exports to ASEAN countries increased 7.2% to $46.4 billion. Imports rose 4.3% to $36.8 billion. Imports from Brazil fell 14.1% to $9.8 billion. 

    China continues to buy large quantities of industrial fuel and metals, although prices have been declining. It will always need raw materials to power its cities, cars and buildings. Imports of iron ore rose 3.2% to 104.1 million tons by quantity but fell 11.5% by value to $9.9 billion.  Imports of copper rose 8.7% by quantity to 2.4 million tons and 22.9% by value to $5.9 billion.

    Domestic Economy

    The domestic manufacturing economy is likely to supply more demand locally instead of shipping overseas. Exports of plastics products fell 4.9% to $8 billion. Exports of toys declined 6.1% to $4.1 billion. Shipments of mobile phones fell 4.9% to $15.1 billion. Shipments of footwear fell 12.8% $3.3 billion. Exports of furniture fell 9.7% to $4.7 billion. Shipments of high-tech products were basically flat, declining 0.7% to $80.6 billion.

    There are a few niche segments that bucked the trend and recorded strong increases in September. Exports of household appliances rose 5.2% to $8.6 billion, and sales of motor vehicles rose 25.7% to $11.6 billion. The rise of the Chinese auto industry, geared toward exporting electric vehicles, continues to be one of the driving forces in modern global trade. The U.S., the EU and Canada have all imposed import tariffs on Chine EVs in 2024. More protectionist action is expected around the world.

    Hi-Tech Supply Chain Intact

    China also needs to keep importing pieces and parts for its supply chains making smart phones and computers. Imports of high-tech products rose 10.5% to $69.7 billion.

    Inflation has been falling rapidly in China, pointing to the end of the Covid-19 pandemic and weakening consumer demand. One sector where prices fell the most was pharmaceutical. Imports rose 23.2% by quantity to 42,217 tons but dropped 1.6% to $4.1 billon by value. 

    The future of the Chinese economy is likely to look much different than it has in the first quarter of the 21st century. The government has announced programs to boost demand, including spending over $25 billion on construction. Officials say they are considering further moves.

    John W. Miller

  • 50 U.S. States Have 50 Trade Economies

    50 U.S. States Have 50 Trade Economies

    The politics of trade in the U.S. have gotten complicated during this century, mainly because deindustrialization in the Rust Belt has cost so many factories and jobs. The free trade consensus of the 1990s that led to NAFTA and China joining the World Trade Organization in 2001 is dead.

     But it shouldn’t be lost on observers of the U.S. economy, or political and business leaders, that the U.S. is still a trade power. Its trade terms are friendly to businesses of all kinds. The U.S. is the world’s top importer, and the number two exporter, behind only China.

    When one breaks down U.S. trade by state, as Trade Data Monitor easily permits in its user-friendly interface, one can see that there’s a new profile for the U.S. trade economy. The top sectors for exports are now electronics, centered around California’s trade with Asia, oil and gas out of Texas and Louisiana, and agriculture, including trade out of Illinois. There are, of course, hundreds of other niche sectors doing well in global markets.

    The top overall exporter is Texas, which shipped out $266.3 billion of goods in the first seven months of 2024, followed by California ($104 billion), New York ($56.1 billion), Louisiana ($49.9 billion, and Illinois ($47 billion.) Texas’s top exports were oil and gas ($128.7 million), electronics ($28.6 million), industrial equipment ($26.1 million), and plastics ($13.7 million). By country, the top destinations for Texas’ exports were Mexico ($72.7 billion), Canada ($22.2 billion), the Netherlands ($18.2 billion), and South Korea ($14.4 billion).

    It’s important to remember that the U.S. has never been a trade monolith. In fact, different trade outcomes in different parts of the country have resulted in political conflict since the beginning of the republic. In the 19th century, for example, Northern industrialists wanted import tariffs to protect their factories. Southern farmers reliant on exports of crops like cotton produced by enslaved labor wanted lower tariffs to keep foreign markets open. In the postindustrial era, the biggest exporters are no longer manufacturing economies like Ohio and Michigan but states with gas and oil fields or big agriculture.

    The most diverse trade economy is California’s, partly because of the state’s ports in Long Beach and Los Angeles. California’s top exports in the first seven months of 2024 were industrial machinery ($18.3 billion), electronics ($17.6 billion), optical and medical devices ($11.6 billion), edible fruits and nuts ($6.5 billion), and aircraft and parts ($4.6 billion). California’s top destinations were Mexico ($19 billion), Canada ($11.1 billion), China ($8.8 billion), Japan ($6 billion), and Taiwan ($5.5 billion).

    California’s been leading the charge in shipping food and agriculture. The top food and ag exporters in the first seven months were California ($12.6 billion), Louisiana ($10.4 billion), Washington ($10.1 billion), Texas ($5.6 billion), and Illinois ($4.5 billion).

    The fifth biggest exporter was Illinois, partly because of its role as a logistics hub centered in and around Chicago. Its top exports were industrial machinery ($8.4 billion), electrical machinery and equipment ($5.5 billion), vehicles ($4.6 billion), food and agriculture ($4.5 billion), and pharmaceuticals ($2.8 billion).  

    On the import side, the top U.S. importers by state in the first seven months of 2024 were California ($275.7 billion), Texas ($229.1 billion), Illinois ($122.1 billion), Michigan ($102.5 billion), and New Jersey ($89.1 billion). California’s top imports were electrical machinery ($59.1 billion), industrial machinery ($52.6 billion), vehicles ($30.2 billion), and gas and oil ($19.7 billion).

  • Don’t Overlook Germany’s Trade Economy

    Don’t Overlook Germany’s Trade Economy

    The conversation about global trade often leaves out the world’s fourth biggest economy and third top exporter and importer, but Germany is poised to play an even bigger role this decade as China and the U.S. remain locked in a trade war.  

    In August, Chinese exports to Germany jumped a whopping 21.5% to $10.1 billion. The surge was part of another strong month for Chinese exports, which have rallied in 2024 despite a wave of tariff actions from Washington to Brussels to New Delhi. Total exports from China rose 8.7% to $308.6 billion. 

    All year, Beijing has been touting its export growth, and analysts expect the government to push the move further. “The continued strong run of exports may actually delay near-term policy support, and we continue to expect bolder measures to be released in Q4,” said Nomura analysts in a report.

    Germany is China’s tenth biggest source of imports, and it’s China’s 7th biggest export market. But as China ramps up its automobile industry, especially in the domain of electric vehicles, its supply chain with car-power Germany has taken on an increased role. In Frankfurt this week, over 800 Chinese car companies including Geely, Hongqi, and GAC International showed up at a trade fair in Frankfurt.

    According to TDM, China’s top exports to Germany in the first seven months of 2024 were electronics ($18.7 billion), machinery ($11.9 billion), vehicles ($3.5 billion), furniture ($2.9 billion), and optical and photographical equipment ($2.3 billion). 

    At the same time, Chinese imports from Germany fell 17% in August to $8.1 billion, but that could be an outlier. The country’s trade deficit with China is only a fraction of the U.S.’s.

    By comparison with Germany, sales to the U.S. increased 5.1% to $47.3 billion and those to ASEAN nations increased 9.6% to $46.6 billion. Overall exports to the European Union rose 13.8% to $46.8 billon.

    One Chinese export market that is also growing strong is Brazil. Chinese exports rose 42.9% to $7.9 billion. According to TDM, China’s top exports to Brazil in 2024 have been electronics, machinery, and cars. The fastest-growing segments has been the cars.

    Shipments of motor vehicles rose 32.6% in August to $10.9 billion. However, shipments of automotive components and parts increased only 6.7% to $8.1 billion. This year, the EU and U.S. have imposed new duties on imports of Chinese electric vehicles. Last month, Canada slapped a 100% tariff on Chinese EVs. India is bumping up its import tax on Chinese steel.

    Exports of rare earths fell 1.1% by quantity to 4,723 tons and 36.7% by price to $4.1 billion. The falling price highlighted a core truth about rare earths. It’s a tiny niche market.

    Sales of consumer staples continued to struggle, suggesting that global consumer demand is still weak. Exports of furniture fell 4% to $4.8 billion, and sales of toys dropped 8% to $4.1 billion. Exports of high-tech products, however, rose 9.6% to $72.8 billion, and shipments of mobile phones rose 17.1% to $8.4 billion.

    On the import side, total purchases increased only 0.5% to $217.6 billion. Of particular note is that China has been cutting its purchases of essential fuels and commodities, suggesting a bleaker outlook for the rest of the year. Imports of crude petroleum dropped 7% by quantity to 49.1 million tons. (By value, they fell 5.4% to $29.4 billion.)

    Imports of coal are finally leveling off. Shipments to China by quantity rose only 3.4% to 45.8 million tons. (By value, they rose 6.9% to $4.4 billion.)  Imports of high-tech products increased 13.7% to $65.1 billion. Imports of iron ore declined 9.9% to $10.5 billion. 

    One good sign for the future of global trade: Chinese exports of ships rose 63.8% in August to $4.1 billion. By quantity, they spiked 41.6% to 497.

  • It’s a Good Summer for Trade But China Ag Imports Fell In July

    It’s a Good Summer for Trade But China Ag Imports Fell In July


    During a summer that’s been a boon for free trade despite a looming escalation in trade wars, and the possibility of a second Trump administration, China’s agricultural imports dropped 4.9% year-on-year in July to $17.8 billion. 

    The trend reflects China’s regulatory practices, strategic protectionism, and shifting demographics. China has blocked some U.S. beef imports because of a prohibited feed additive, the sector is a favorite avenue of retaliatory actions, and the country’s population has recently started to contract. Purchases of meat fell 32.1% to $1.8 billion. Imports of fresh or dried fruit declined 20.4% to $1.1 billion. Imports of grain and soybeans both rose a few percentage points by quantity but fell around ten percentage points by value. Agricultural exports increased 1.9% to $8.3 billion.

    Overall China’s exports rose 7% year-on-year in July to $300.6 billion, while imports increased 7.2% to $215.9 billion. The strong trade figures surprised many observers. The U.S. and European economies have been surprisingly resilient in 2024, and inflation has been waning. Another factor: Purchasing managers are stocking up in anticipation of punitive trade actions. The EU last month imposed temporary tariffs of up to 37.6% on imports of electric vehicles from China. It’s expected to make them permanent this fall. The U.S. is preparing tariffs on a host of Chinese high-tech goods. Vincent Clerc, the CEO of shipping giant AP-Moeller-Maersk, told the Financial Times that their customers were “bringing orders forward” because “of the potential for a trade war, people would rather have Christmas goods already in the warehouse.”

    Demand in Western markets appears strong despite the risk of economic recession spotlighted by Monday’s stock market hiccup. Exports to the EU increased 8.4% to $45.8 billion, while shipments to the U.S. increased 8.2% to $45.8 billion. By comparison, exports to ASEAN countries increased 12.5% to $46.9 billion.

    However, there are signs that consumers around the world are feeling less prone to spending money in their pockets than they were during the heady days of Covid stimulus payments. Exports of furniture dropped 5% to $4.7 billion. Shipments of suitcases increased 5.2% by quantity to 311,145 Tons but fell 11.1% by value to $2.7 billion. Shipments of toys fell 3.6% to $3.7 billion. The same demographic crunch that could pose a risk to China’s appetite for agricultural products is likely in the long run to hurt China’s competitive advantage in manufacturing these low-tech products. Labor is likely to get squeezed, especially as the country capitalizes on its growing edge in high-tech goods, include solar panels and electric vehicles. 

    Despite the moves by U.S. and European policymakers to levy tariffs on Chinese imports, the country’s high-tech sector is still strong. Exports of motor vehicles increased 13.8% to $10 billion, while shipments of high-tech products rose 12.1% to $74.9 billion. Exports to Africa fell 7.1% to $13.5 billon, while imports from Africa increased 2.9% to $8.9 billion. 

    On the import side, the highlight was a boom in imports from the U.S., which increased 23.7% to $14.9 billion. The preliminary report doesn’t break out countries by specific product, but according to an analysis by Trade Data Monitor, in the 12 months between July of 2023 and June of 2024 included, the top Chinese imports from the U.S. included semiconductors, petroleum, copper, cars and fresh fruits and nuts. 

    Imports from the EU rose 7.5% to $24.9 billions, while purchases from ASEAN nations rose 11.4% to $33.3 billion. Imports of high-tech products rose 18.6% to $66.7 billion. 

    China’s appetite for industrial goods, an important bellwether for the global economy, appears solid. Imports of coal increased 17.5% to $4.5 billion. (It also rose by roughly the same amount by quantity.) China ramped up imports of iron ore and copper quantities by roughly 10% each. 

  • How Tariffs Are Reshuffling EV Trade

    How Tariffs Are Reshuffling EV Trade

    Age of the EV

    We’re entering the age of the electric vehicle, and global trade is keeping pace. Around 20% of all cars bought in the world in 2023, a total of almost 14 million, were electric, and there are now 40 million on the road, according to the International Energy Agency. Total trade in electric vehicles amounted to around $150 billion in 2023, up over 50% from 2022. The EV market is concentrated in the world’s top three economic poles: In 2023, 95% of EV sales were in China, the U.S., and the EU. These economies have the battery and automotive supply chains they need to maintain a robust EV manufacturing capacity.

    Germany v. China

    During this decade, Germany and China, now the world’s top two overall car exporters, have been running neck-and-neck in electric vehicle (EV) exports. In the first quarter of 2024, Germany exported $8.9 billion of EVs and China shipped out $8.1 billion, according to TDM data. South Korea, in third place, exported $3.4 billon, followed by Belgium ($3.2 billion), Japan ($1.7 billion), and the U.S. ($1.5 billion). 

    Americans Buy

    For all its purported troubles, the U.S. is still, in many ways that count, the world’s top consumer economy. The U.S., which shipped in $20.4 billion worth of EVs in 2023, is the world’s top importer of EVs, followed by Germany, the UK, Belgium and France. The U.S.’s top sources are Germany ($6.2 billion), South Korea ($4.4 billion), Mexico ($3.8 billion), Japan ($3 billion), Belgium ($1.5 billion), and Hungary ($600.9 million). China ($367.8 million) ranked seventh.

    The China EV Booms

    Like Japan in the 1980s and South Korea in the 1990s, China has dramatically expanded its automobile export capacity. Unlike those two economies, it’s benefitted from foreign investment and from a revolutionary new technology, electric vehicles. The auto industry is a massive part of the global economy, representing around 3% of total output. China has been the world’s top producer and market for cars since 2009. Thanks to massive investment and solicitation of foreign auto producers, China has been a net auto exporter since 2021. EVs now represent 44% of total Chinese auto exports, up from less than 1% in 2018.

    Here Come Tariffs

    Fearful of getting crushed by Chinese EV imports, the U.S. and EU have been throwing up protectionist walls against Chinese EVs. In May, the U.S. announced 100% tariffs, up from 25%, on imports of Chinese EVs.

    In early July, the European Union imposed provisional tariffs of up to 37.6%, in addition to the EU’s standard 10% duty on auto imports, on Chinese EVs entering the 27-nation bloc. Chinese EV companies have advanced technology and produce their vehicles roughly 30% more cheaply. The EU duties are set to last at least four months. Chinese trade officials have said they will retaliate by slapping tariffs on U.S. and European goods.

    Around half of Chinese car exports are made by Western companies like Tesla, Volkswagen, and Volvo, now China-owned, or in cooperation with Chinese firms. Tesla has said its Shanghai factory is it top export hub. In 2023, China was the world’s second largest exporter of automobiles, up from sixth in 2018.

    How China Fights Back

    Five of China’s top ten destinations for EVs in 2023 were EU members: Belgium, Spain, Germany, the Netherlands, and Slovenia. The other six countries in the top ten markets were the UK, Thailand, Australia, Canada, and Israel. The U.S. was China’s 22nd biggest market.

    How will it cope with tariffs? China’s real weapon is that it has diversified its auto export base. In 2023, it exported over a billion dollars’ worth of cars, trucks and part to 38 different countries. The Chinese automobile industry’s top customer: Russia. In 2023, it imported $22.5 billion worth of autos and auto parts, up from $6.3 billion in 2022, leapfrogging from fourth to first. However, only a small percentage, around a quarter-billion dollars’ worth, was EVs.

    Chinese exports of EVs to Brazil skyrocketed to $1.1 billion from around $20 million in the first five months of 2024. This year, Brazil has been China’s third biggest market for EVs, up from 22nd in 2022. The U.S. so far in 2024 has been China’s 29th biggest market, with only $57.4 million in exports.

    John W. Miller is TDM’s Chief Economic Analyst. For more information visit tradedatamonitor.com

  • China’s EV Export Boom is Driving up Demand for RoRo Ships

    China’s EV Export Boom is Driving up Demand for RoRo Ships

    China’s electric car export boom has fueled demand in the country for automobile transport ships, driving up prices for foreign buyers.

    Overall, in March, Chinese ship exports fell 5.9% year-on-year by quantity in March to 399, after steadily rising for most of this decade. By value, they increased 34% to $3.1 billion. So called Roll-on/roll-off, or RoRo, vessels, are bigger and more expensive than ships used to transport containers or bulk commodities like coal, grain, and oil.

    Car companies in China need the new ships. The country’s exports of motor vehicles increased 29.1% to $9.4 billion. And consumers in China are increasingly buying domestic. Imports of vehicles shrank 24.2% to $2.9 billion. 

    The ramp-up in Chinese car exports requires a capacity increase. Vessels large and technology-equipped enough to carry thousands of cars to the other side of the planet aren’t just lying around. China has been engaged in a furious bout of shipbuilding, for both commercial and military purposes. 

    In 2023, Chinese ship production rose 12% from the year before, to over 40 million deadweight tons, easily most in the world. New order for RoRo ships make up 83% of global new orders, according to the China Association of the National Shipbuilding Industry. Shipyards in China are expected to build an additional 200 RoRo ships before 2026, double the number in the period between 2015 and 2022.

    The car industry, however, can’t cover for a tepid global economy. Overall, Chinese exports declined 7.5% in March to $279.7 billion. Consumers in the U.S. and Europe are still trying to establish a post-Covid footing after stimulus money has run out. Exports to the European Union dropped 13.3% to $39 billion, and shipments to the U.S. dropped 11.9% to $36.7 billion.

    Asia seems to be faring a little better than other regions. Sales to ASEAN countries rose 1.4% to $52.9 billion. But expect the slump to continue. “Export volumes will rise more slowly this year, given that consumer spending in advanced economies is cooling and the tailwind from last year’s sharp drop in export prices is fading,” wrote Zichun Huang, an economist at Capital Economics.

    Consumer demand isn’t the only risk. Treasury secretary Janet Yellen met with Chinese officials in early April to warn the country against overproduction that might flood global markets. The U.S. is investigating electric vehicles imports from China as a national security risk, and the EU has launched an anti-subsidy probe. China has complained to the World Trade Organization that U.S. subsidies for electric vehicles that prohibit Chinese parts are discriminatory.

    The decline in exports was underpinned by slumps in sales of consumers staples. Exports of garments dropped 17.6% to $10.4 billion. Exports of toys fell 15.7% to $2.9 billion. Slightly brighter spots: Sales of household appliances fell only 0.6% to $8 billon, and shipments of high-tech products fell 0.9% to $72.5 billion.

    Some markets that have seen promising are also flailing. Exports to India dropped 16.6% to $8.5 billion. Shipments to Russia, whose economy is starting to feel the effects of the war in Ukraine, fell 14.2% to $7.6 billon. However, exports to Vietnam rose 11.2% to $14.9 billion, and exports to Taiwan increased 6.6% to $6.2 billion.

    Overall, imports fell 1.9% to $221.1 billion. Imports from the EU fell 5.7% to $23.3 billion, and purchases from the U.S. declined 12.5% to $13.8 billion. Imports from ASEAN countries fell 2.9% to $32 billion. Increasingly, China is buying more from other countries. Imports from India rose 4.8% to $2 billion, and imports from Russia increased 7.5% to $11.9 billion.

    One reason that imports are faring better than exports: China still needs plenty of industrial commodities to build cars and ships. Imports of iron ore rose 5.3% to $12.7 billion, purchases of copper rose 15.1% to $5.1 billion, and shipments of high-tech goods to China rose 6.4% to $61.7 billion.

    John W. Miller

  • China Reboots Trade Thanks to Africa, India, Latin America

    China Reboots Trade Thanks to Africa, India, Latin America

    Don’t let anybody tell you that globalization is dying—at least, not yet.

    Global trade economists obsess over consumer demand and rising protectionism in the U.S. and Europe, but this week’s release of Chinese trade statistics shows that other markets might soon be catching up in relevance.

    The Promise of Other Markets

    China’s exports to Latin America, Africa and India all rose by double-digits in the first two months of 2024. China releases its January and February trade data together every year to make up for the dip corresponding with Chinese New Year, which can fall in either month. The unique two-month batch of trade data is one of the spring’s most hotly-anticipated economic releases.

    Overall, China’s exports increased 7.1% year-on-year in January and February to $528 billion, and the country’s imports rose 3.5% to $402.9 billion. The relatively strong performance surpassed analysts’ expectations thanks to a recovery in global consumer demand, an expansion in high-tech investment and artificial intelligence, and a low baseline because of Covid shutdowns in 2022 and 2023. It also matched with encouraging economic data from other regions of the world, including South Korea, Germany, and Taiwan. 

    A Slump in Europe

    Exports to the U.S., China’s largest single trade partner, increased 5% to $73.4 billion, and exports to ASEAN countries rose 6% to $82.7 billion. The negative outlier among the top trading partners was the European Union. Exports to the EU fell 1.3% to $78.3 billion.

    The biggest surprise was how much China exported to countries that rank in the middle or at the bottom of the world’s economic league table. Exports to Latin America rose 20.6% (and were up 33.8% to Brazil) to $40.9 billion, shipments to India rose 12.8% to $19.5 billion, and sales to Africa rose 21% to $28.8 billion.

    “As our export commodities are climbing up the value chain, coupled with China’s proactive opening up and the expansion of import market opportunities, China has great potential both in import and export,” said minister of commerce Wang Wentao at a press conference this week. Wang pointed out that China’s export reboot has become increasingly reliant on what he called the “big three”: Electric vehicles, lithium-ion batteries, and solar panels.

    Classic Manufacturing Rebounds

    Thanks to demand driven in part by consumer in Latin America, Africa and India, China’s traditional manufacturing consumer staples are enjoying a resurgence. Exports of footwear, for example, rose 14.4% to $8.7 billion. Exports of toys increased 15.9% to $5.7 billion. And its heavy industrial sector continued to hum. Sales motor vehicles rose 12.6% to $15.7 billion, and exports of ships rose 173.1% to $6.8 billion. Exports of mobile phones increased 12.8% to 123.7. million by quantity, and dropped 18.2% to $19.3 billion by value. Exports of rare earths rose 18.7% by quantity to 8,773.9 tons. By value, they shrank 44% to 81.8$ billion, demonstrating by their price decline that they are perhaps not as rare as some would have you believe. 

    Asian Exporters March On

    On the import side, the U.S. and Europe continued to lose out to Asian partners. Imports from the EU fell 9.4% to $39 billion, and from the U.S. dropped 9.7% to $26.1 billion. Imports from ASEAN countries increased 3.3% to $57 billion, and from Latin America increased 8.1% to $41.7 billion. Imports from India increased a whopping 34.7%, but from a lower baseline of $3.7 billion. Imports fell across a wide variety of categories and were saved only by big purchases of mechanical and electrical products, up 7.7% to $137.2 billion; iron ore, up 22.8% to $27.5 billion; and crude oil, up 2.8% to $51.3 billion.

    The export resurgence has further boosted China’s trade surplus with the rest of the world. It was $125.1 billion in the first two months, up from $116.9 billion over the same period in 2023, and a new record.

  • Vietnam’s Secret Weapon: Agriculture

    Vietnam’s Secret Weapon: Agriculture

    In a tricky global economy, Vietnamese exports shrank in 2023, but the rising economic power managed to be one of the only countries to increase merchandise exports to China, thanks to a surprising surge in exports of fruits and vegetables, as well as rice, demonstrating the importance of export diversification.

    The Difficulties of 2023

    The country of 97.5 million encountered headwinds in 2023. Its gross domestic product rose only 5.1%, below recent trends. In 2022, it had been 8%. Some foreign investors pulled back amid crackdowns on corruption. Vietnam’s imports fell 9.2% to $326.4 billion, an indication of general economic sluggishness.

    The Vietnamese export machine, key to the country’s prosperity, closed the year strong. In December, the country’s exports increased 8.1% year-on-year in December to $31.5 billion. However the jump couldn’t save Vietnam’s year. Total exports in 2023 fell 4.6% to $354.7 billion. Exports generated by foreign companies fell 6% in 2023 to $257.2 billion. Vietnam was hurt by the same confluence of forces that damaged trade elsewhere: inflation, weak consumer demand, and regression after a post-Covid boom.

    Exporting to Prosperity

    The key to Vietnam’s economic growth is its export sector, which is heavily reliant on shipments to two markets, China and the U.S., the world’s top two economies and superpowers keen to forge alliances with Vietnam. Ever since China joined the World Trade Organization in 2001, the U.S. and European Union have salivated about prying open the country’s billion-consumer market. Vietnam is still only the 11th biggest supplier of Chinese imports, but unlike Europe and the U.S., its shipments to China have been rising. In 2023, Vietnamese exports to China increased 5.6% to $61.2 billion, while U.S. exports to China fell 4% and European Union exports rose only 0.4%.

     The Diversification Trick

    Vietnam’s trade with the bigger power isn’t concentrated in a few sectors. Exports to China of fruits and vegetables, for example, leapt 138.7% to $3.6 billion in 2023. Exports of computers, electrical products and parts rose 9.8% to $13 billion. And sales of mobile phones ticked up 3.7% to $16.9 billion. To be sure, Vietnamese exports to China of cement, coal, crude oil and wood all fell, but the country isn’t exclusively reliant on a few commodities.

    By comparison, in 2023 Vietnamese exports to the U.S. declined 11.3% to $97 billion. Exports of textiles and garments dropped 16.7% to $14.5 billion. Shipments of mobile phones and parts fell 33.5% to $7.9 billion. And sales of machines, equipment and tools fell 9.8% to $18.2 billion. And there was no surge in agricultural exports to make up for the shortfalls. Sales of fruits and vegetables rose 4% to a meager $257.7 million. Exports to the U.S. of Vietnam’s thriving fisheries sectors dropped 26.9% to $1.6 billion.

    The Battle for Vietnam

    As Vietnam’s economy has matured, it has developed into a strategic economic ally for every economic power in the world. Chinese manufacturers see a ripe consumer market. U.S. industry sees a less fraught low-cost labor market. And everybody else sees a young, dynamic country climbing the rankings of the world’s economies. It’s no surprise that both U.S. president Joe Biden and Chinese leader Xi Jinping visited Vietnam during the second half of the year. It was the only country that both leaders visited in 2023. Everybody wants a piece of Vietnam.

    But trade with Vietnam did not fare as well in 2023 as countries had hoped. Exports to the European Union fell 7% to $44 billion, while imports from the EU dropped 4.1% to $15.3 billion. Exports to ASEAN countries dropped 4.5% to $32.6 billion. Imports from ASEAN countries declined 13.5% to $40.9 billion. Exports to the United States dropped 11.3% to $97 billion. Imports from the U.S. fell 4.5% to $13.8 billion. Exports to China rose 5.6% to $61.2 billion. Imports from China fell 6.6% to $110.6 billon. So the only categories to grow in the major trading relationships was exports to China.

    Silver Linings

    There were a few other bright spots. Exports to India rose 6.8% to $8.5 billion. Total exports of fruits and vegetables increased 66.7% to $5.6 billion, and total rice exports rose 35.3% to $4.7 billion. However, exports of footwear dropped 15.3% to $20.2 billion, and exports of textiles and garments fell 11.4% to $33.3 billion. The government has set a GDP growth target of 6% to 6.5% in 2023. With those traditional sectors dropping off, Vietnam will have to keep diversifying if it wants to meet its target.

  • What’s Behind the High-Tech Trade Slump?

    What’s Behind the High-Tech Trade Slump?

    It’s not been an easy time for international trade, as a recent report co-authored by Trade Data Monitor and the World Intellectual Property Organization found.

    High-tech exports are set to decline by 4 percent in 2023, according to the TDM/WIPO analysis. Global and high-tech trade have soared and sunk like rollercoasters since 2019. After the strong post-pandemic recovery in 2021 followed by a slowdown in 2022, total merchandise trade is expected to grow at a meagre 0.8 percent in 2023.

    Changing global value chains and geopolitical tensions are driving some of the trade slowdown, as well as inflation which is increasing the costs of traded high-tech goods. The development of new sectors, particularly in the manufacturing of renewable energies, batteries and electric vehicles, helps mitigate the high-tech growth slump, however.

    The key player, as a consumer and manufacturer, is still China, and Chinese high-tech exports fell 11.4% to USD 728.2 billion in the first 10 months of 2023. The country’s smartphone exports fell by close to 7% to USD 106.8 billion, and sales of its data processing machines dropped 24% to USD 82.8 billion (see Figure 3). Shipments to many of China’s traditional trading partners dropped. Exports to the U.S. fell by 21% to USD 102.7 billion; to the Republic of Korea by 13.4% to USD 33.9 billion, and to the Netherlands by close to 20% to USD 33 billion. Still, despite the decline, China is the leading high-tech exporter by far.

    Other Asian economies also experienced high-tech export declines. Exports of the Republic of Korea, for example, declined by 28% to USD 110 billion. Japanese exports fell 10% to USD 76.9 billion. Viet Nam’s export fared better, falling 1.7% to USD 115 billion in the first nine months of 2023.

    By contrast, U.S. high-tech exports rose 4.4% to USD 282.5 billion. Shipments to Germany, the Netherlands and Belgium all rose by double digits. U.S. exports of smartphones, routers, board and panels, parts for gas turbines, and computers all increased.

    Germany’s high-tech exports rose 6.6% to USD 217.4 billion over the first ten months of 2023. Exports of big airplanes rose 26.8% to USD 19.7 billion, shipments of immunological products rose 9.4% to USD 24.5 billion, and sales of processors and controllers, electric integrated circuits jumped 23.5% to USD 9.6 billion. And France’s high-tech exports increased 2.7% to USD 97.7 billion, thanks to increases in shipments of airplanes (up 16.9% to USD 19.7 billion), electronic integrated circuits (up 16.9% to USD 5.6 billion), and spacecraft, including satellites (up 438.4% to USD 2.1 billion). 

    Other fast-growing high-tech exporters in Europe include Austria, Hungary and Poland. Austria’s high-tech exports rose 16.9% to USD 22.1. billion in the first 10 months of 2023, thanks to hikes in shipments of anti-serum, up 26.7% to USD 3.8 billion, electrical panels, up 17.3% to USD 983 million, and transistors, up 40.8% to USD 650.1 million.

    Hungary’s high-tech exports increased 10.8% to USD 20 billion, on the back of sales of processors, up 11.2% to USD 2.3 billion, routers, up 27% to USD 1.7 billion, and smartphones, up 99.7% to USD 1.1 billion. Polish high-tech shipments increased 7% to USD 29.5 billion thanks to sales of data processing machines, airplane parts and hearing aids.

    John W. Miller