Industry: Textiles

  • Global Trade is Moving On — Without the U.S.

    Global Trade is Moving On — Without the U.S.

    One way of looking at China’s trade economy in December and for the full 2025 year is its export surge, amplified by a weak currency, deflation at home, and inflation in most of the rest of the world. China pumped up total monthly exports 6.6% to $357.8 billion in December from $335.6 billion over the same period in 2024. 

    Here’s another angle: Washington’s efforts to crimp Beijing’s industrial sector have resulted in diminished U.S.-China trade, but even bigger Chinese surpluses with the rest of the world, and evolutions in global trade that are simply leaving America behind. For the full year, China exported $3.8 trillion worth of goods. Minus imports, that made for a total surplus of $1.19 trillion, the biggest in recorded economic history. 

    Chinese officials themselves have drawn direct links between U.S. policy and its surplus, saying in effect that without tariffs, Beijing would have bought more goods from the rest of the world. “Some countries have politicized economic and trade issues and restricted exports of high-tech products to China for various reasons; otherwise, we would have imported even more,” Wang Jun, a Chinese trade official, told reporters Wednesday. 

    According to the Petersen Institute for international economics, U.S. tariffs on Chinese exports average around 47%, while China’s average tariffs on US exports are around 32%.

    The Chinese export juggernaut needs markets like nature abhors a vacuum, and it’s found new landing places for its voluminous container ships. Exports to the European Union increased 11.5% in December to $51.9 billion. Exports to Germany increased 13% to $11 billion. By comparison, exports to the U.S. fell 30.2% to $34.2 billon. We are seeing the wheels of human economic history turn in real time. Global trade is still inching upward every year. The rest of the world is getting on with it, leaving the U.S. behind. While ports on the East and West coasts slow their activity, they’re busy in Asia, Europe, Latin America and Africa. Exports to ASEAN nations increased 11.3% to $66.4 billion, including a 20.4% jump to Vietnam to $18.9 billion; shipments to Latin America rose 9.8% to $25.7 billion; and sales to India increased 22.1% to $12.8 billion.  

    The story of global trade right now is geopolitics. It’s the jolt of the U.S. away from its post-war free trade consensus. There is another story we’ve discussed here that is less surprising but still ongoing. It’s the move of China and other Asian countries up the value chain, away from toys and shoes and into tech and cars. At the same time, countries like Egypt, Bangladesh and Cambodia continue to build up their apparel and textile exports. 

    In December, Chinese exports of high-tech products increased 16.7% to $93.7 billion. Sales of motor vehicles increased 73.2% to 994,000. By value, they rose 71.7% to $17.1 billion. Exports of toys fell 19.4% to $2.7 billion. Shipments of footwear dropped 17.4% to $3.9 billion. 

    On the import side, China ramped up purchases 5.7% to $243.6 billion from $230.5 billion. The relationship with the EU seems more two-sided than in the past. Imports from the EU rose 17.9% to $26.9 billion, while purchases from the U.S. plummeted 28.6% to $10.9 billion. Imports from Germany increased 13.6% to $8.9 billion. Imports from Latin America increased 26.8% to $24.4 billion. Imports from India rose 56.5% to $2.2 billion.

    Buying more from Europe and Latin America was also at the expense of some Asian neighbors. Imports from ASEAN countries fell 5.1% to $35.7 billion. Even imports from Vietnam were flat at $9.5 billion. 

    Imports of high-tech products rose 13.6% to $82.6 billion. Purchases of soybeans increased 4.7% to $3.9 billion. China still needs a protein supply, and it’s getting it from Brazil instead of the U.S.

    One sign the Chinese economy is doing just fine: China ramped up purchases of natural resources. It increased quantities of imports of iron ore by 6.5%, copper 7.3%, coal 11.9%, oil 17.4%, and natural gas 90.2%.

  • TDM’s Top 10 Trade Trends to Watch in 2026

    TDM’s Top 10 Trade Trends to Watch in 2026

    Happy New Year. While we wait on the Supreme Court to rule whether the Trump administration is entitled to apply tariffs on national security grounds, global trade grinds on. We at Trade Data Monitor are paying attention to what’s happening via the prism of official trade statistics. It’s a radically different world than when I started covering trade for the Wall Street Journal 20 years ago. The biggest story is still in tech, where the economy is being transformed by investment in chips and other electronics used to make artificial intelligence systems. Shut out of the U.S., many Chinese exporters are finding new markets in Europe. Beijing is not giving up its export-dependent growth model, which in 2025 propelled the world’s first-ever trillion-dollar trade surplus. Via our system for reverse engineering trade data, we can discern that Russia’s import demand is shrinking. Vietnam is still climbing the economic ladder, thanks to an export portfolio that includes staples like toys and shoes, but also high-value electronics. Most of the world has not given up on trade. In October, global container volumes increased 2.1%. However, the U.S. is an outlier. According to Bloomberg, the U.S. saw an 8% contraction in inbound shipments. Although President Trump threatened much higher levies, the U.S. effective tariff rate is “only” around 15%. That’s its highest level since the 1930s, and it’s the main reason the WTO is now forecasting 0.5% growth in global trade in 2026, instead of 1.8%.Here are our top trade trends to watch in 2026.
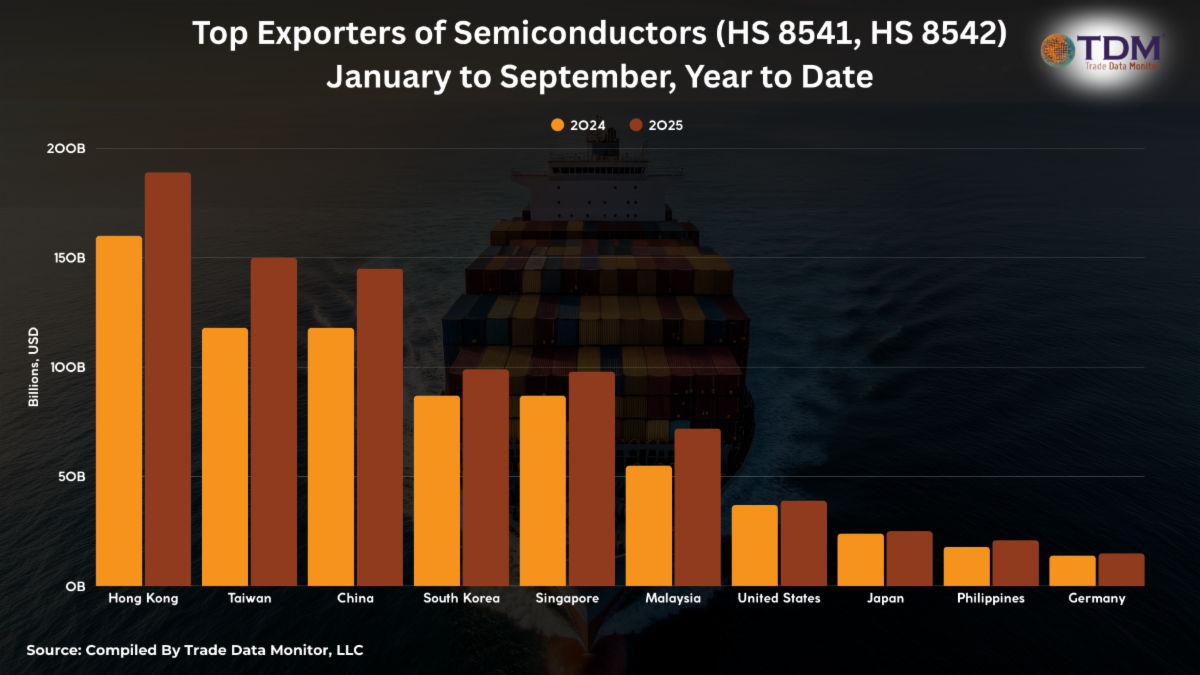
    1.   The Asian Chip MiracleThe chip market is expected to reach around $750 billion in 2026 and hit $2 trillion by the early 2030s. In its latest incarnation that trend is being led by Asia. Eight of the world’s top 10 exporters of chips, classified under HS8541 and HS8542 are Asian. Only the U.S. and Germany crack the top 10. 
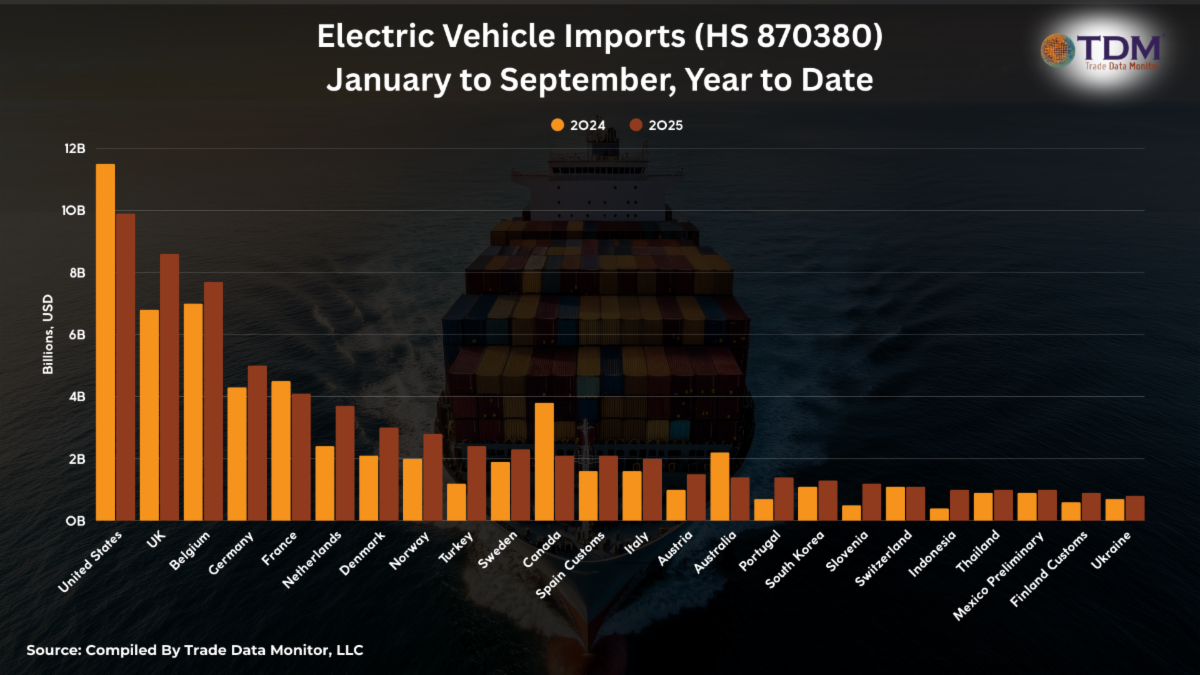
    Thanks in part to the chip industry, and parallel industries in batteries, engines and electronics, the electric vehicle industry is thriving. Slowly, the world’s road and filling stations are being rewired. In country after country, electric car imports have been increasing.  One consequence is booming trade in the critical minerals, like cobalt, manganese and nickel, needed to build electric cars and batteries. We’ll explore that trade in our February newsletter. 
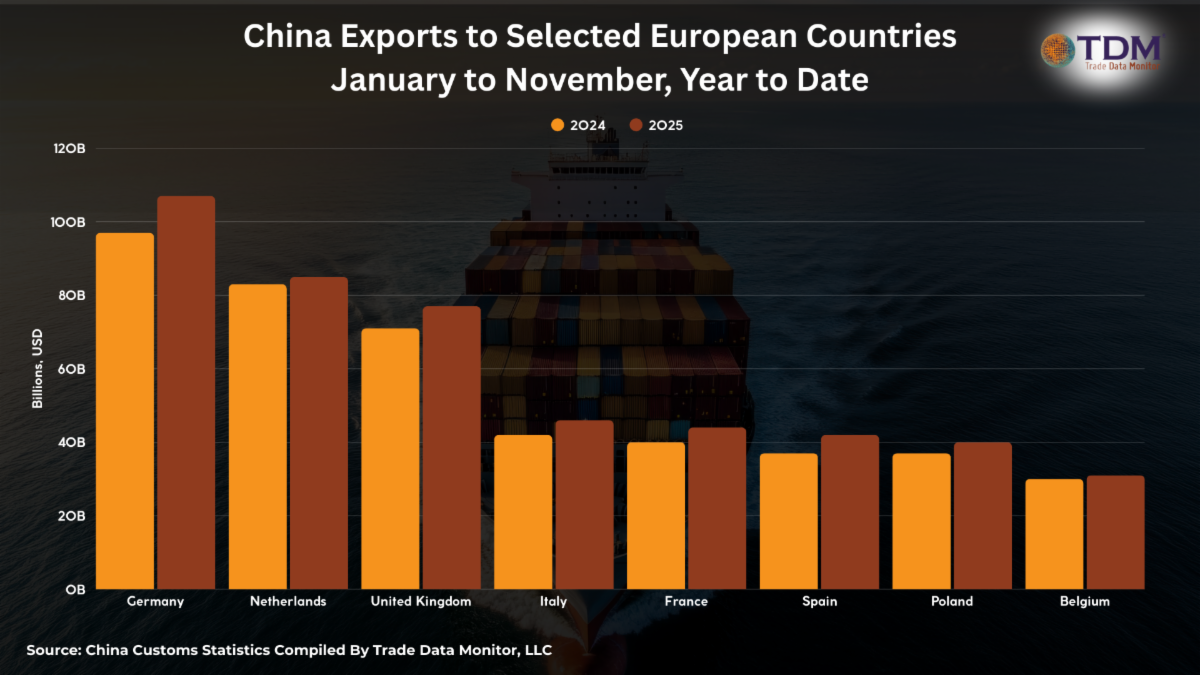
    2.   China Finding Markets in EuropeWith the U.S. throwing up roadblocks, Chinese exporters have been finding markets in Europe. That’s triggered a crisis for European domestic manufacturers, who are now having to compete with the China price Americans have turned down.
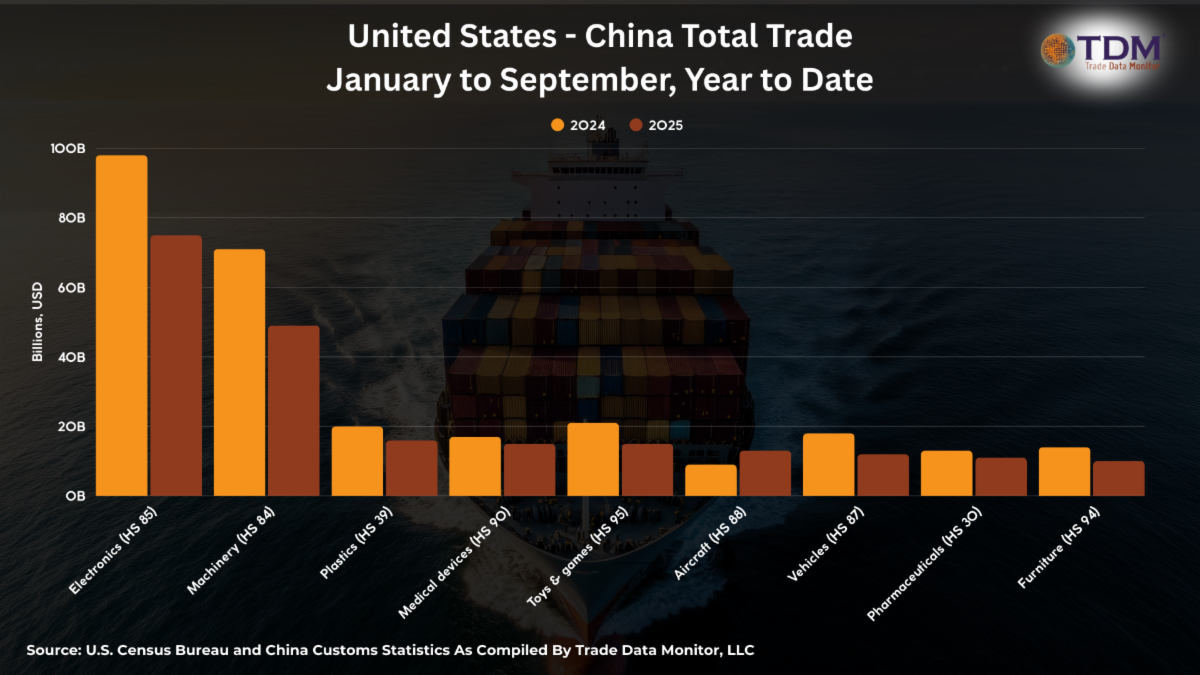
    3.   Where is U.S.-China Trade Headed?The future of the U.S.-China trade relationship seems uncertain at best. When we added up total trade between the two behemoths, the only sector has grew in 2025 was aircraft. The U.S. shipped $12.5 billion of aircraft and aircraft parts to China in the first nine months of 2025, up 45% from the same period in 2024.
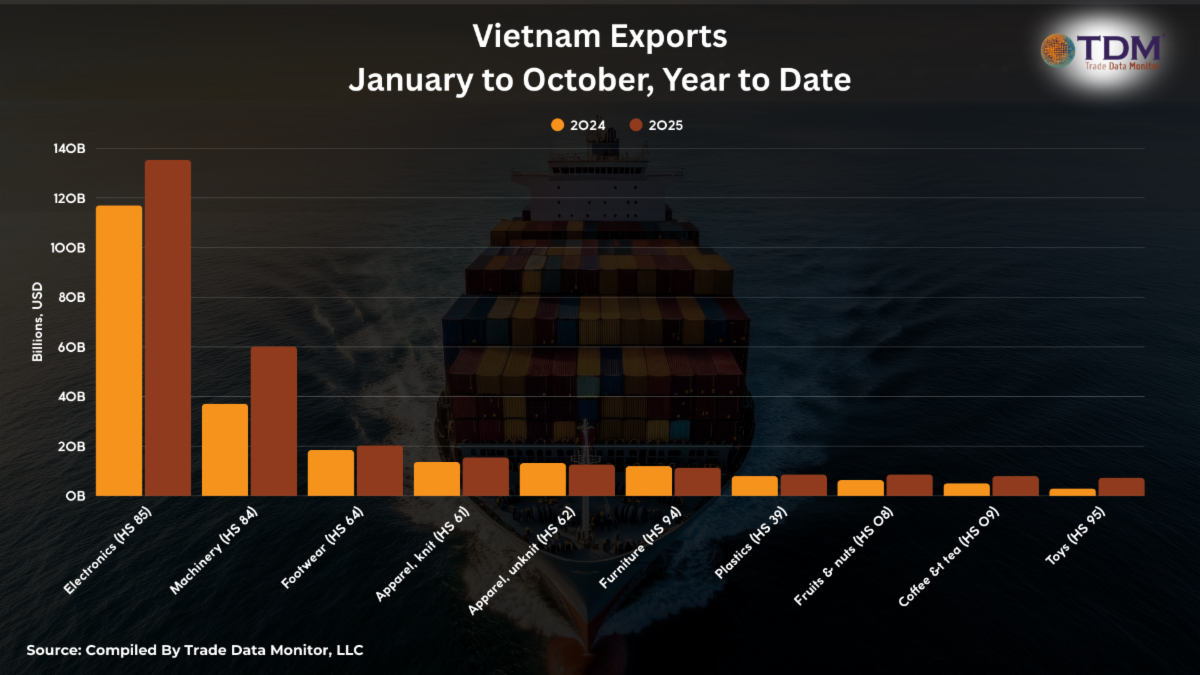
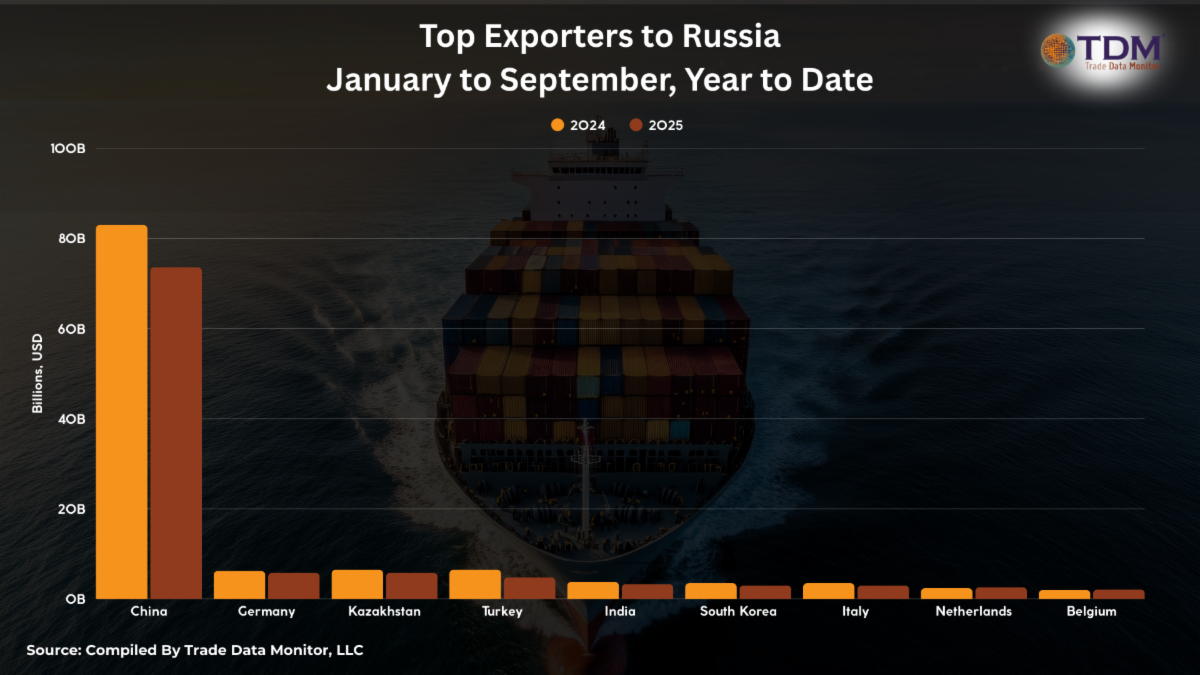
    4.   How Vietnam is Winning Global TradeAt TDM, we’ve been talking about Vietnam’s promise for a decade, so we’re not surprised to see its strong export numbers. The remarkable thing about Vietnam isn’t that it has become an export machine, it’s that its manufacturing capacity has increased across so broad a base. 5.   Russia’s Shrinking Import DemandRussia still isn’t publishing trade statistics, but thanks to the breadth of TDM’s database, we can look at which countries are shipping to Russia. Those exports to Russia are mostly shrinking, an indication of the battering Russia has been taking from the war. The IMF and other institutions predict Russian GDP growth of only around 1% in 2026. 
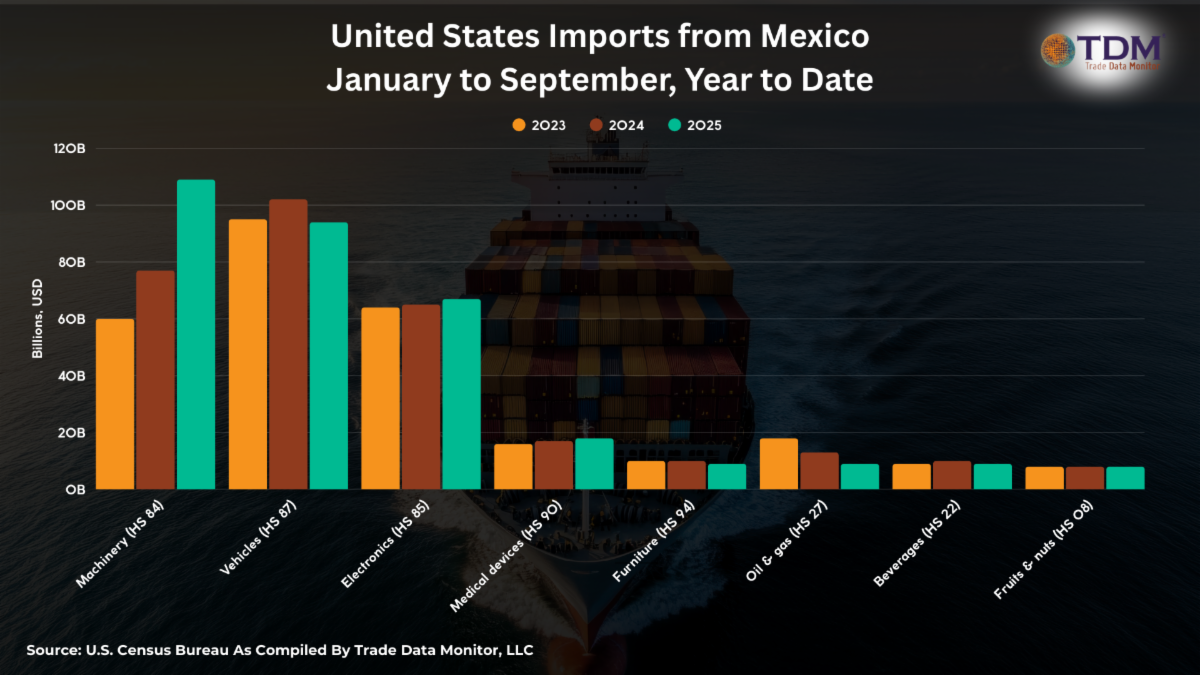
     6.   U.S. Imports from MexicoThe biggest beneficiary of the U.S.’s trade war with China has been Mexico. Although the two countries, and Canada, are now renegotiating the USMCA, businesses have had confidence they can manufacture in Mexico and ship north. Mexico has been suppressing data, but U.S. import statistics paint a picture.
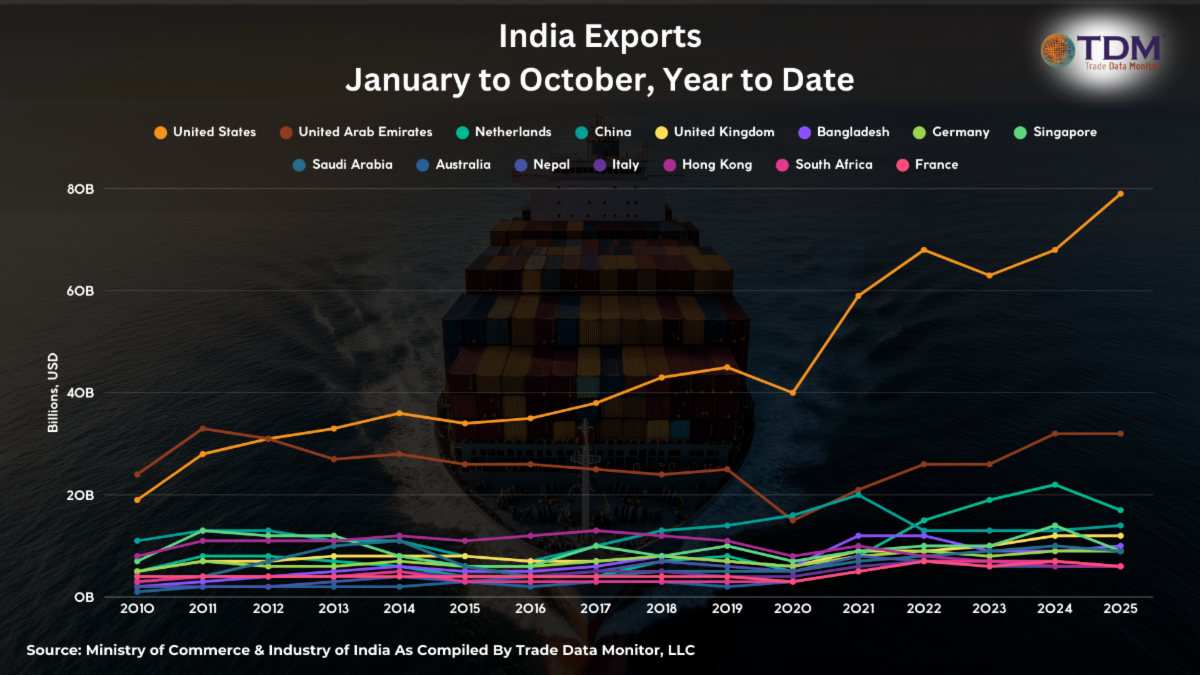
    7.   Indian ExportsNow with the world’s biggest population, India has now overtaken Japan as the world’s fourth biggest economy, behind the U.S., China and Germany. Its top market: the U.S., followed by UAE and the Netherlands. 
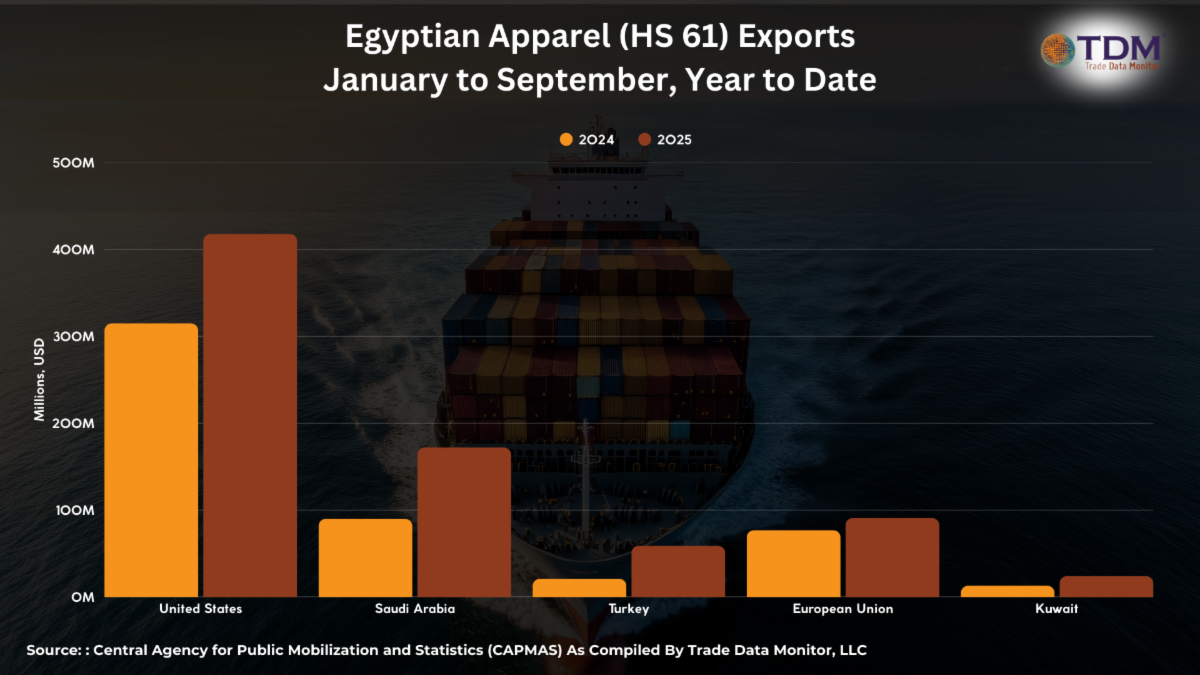
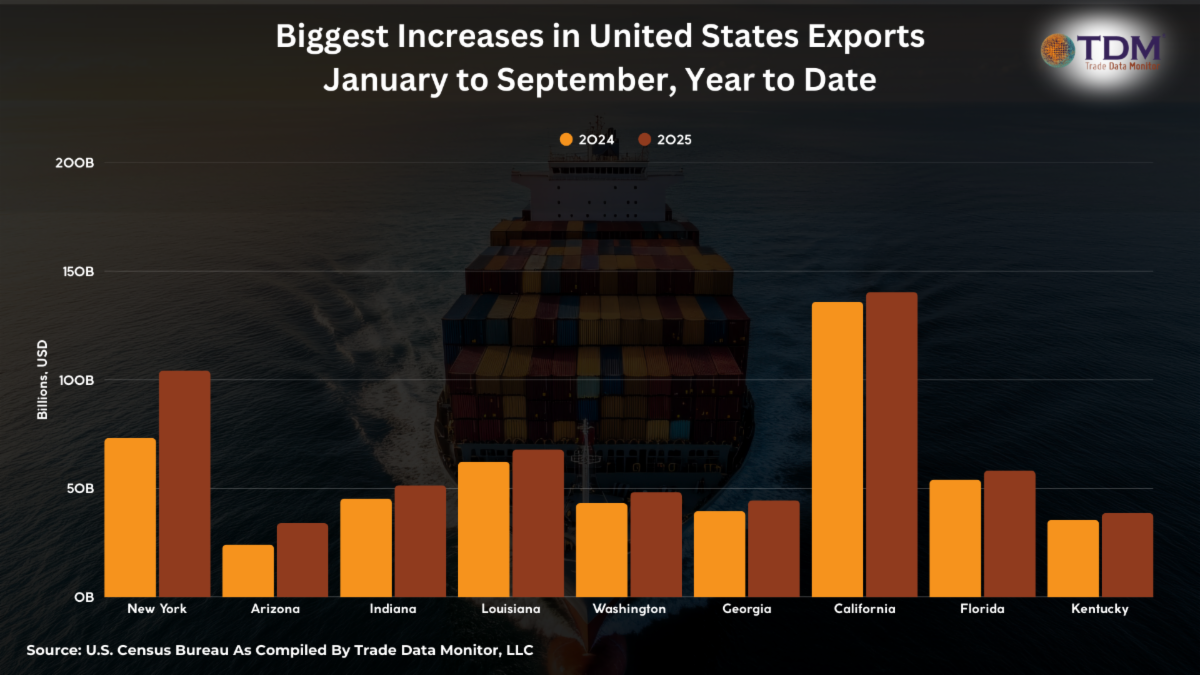
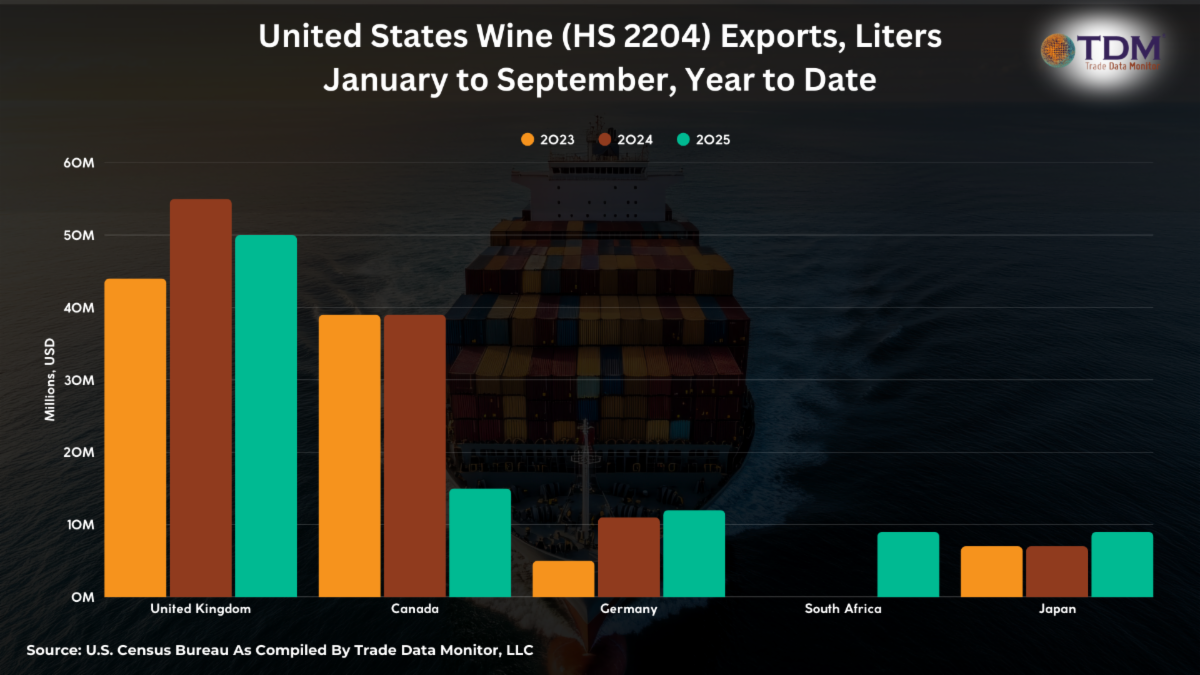
    8.   Trade Case Study: EgyptTrade coverage focuses on the big countries, but we’ve been studying smaller players, and one interesting case study is Egypt. It’s been boosting apparel exports, a sign of a country’s increasing prosperity and competitiveness on export markets. In 2025, Egypt clocked the biggest increase in apparel exports, shipping out $2.6 billion in the first nine months of 2025, 30.7% more than the year before. The second highest increase was registered by Cambodia at 16.9%, and no other country improved by double digits. 9.   What States’ Ports and Economies Are Thriving MostAmerica is a huge continental economy with dozens of distinct economic regions and sea- and airports. We sorted every state by increase year-on-year in exports from the place it’s leaving the U.S., over the first nine months of 2025. Texas and California are still the biggest exporters overall, but New York leads the race in year-on, because of its trade in physical gold. Arizona ranks second because of its electronics trade with Mexico. Third is Indiana, thanks to its exports of hormones to Italy. 10.   U.S. Wine ExportsA retaliatory tariff and a “Buy Canadian” movement have dented U.S. wine exports to its northern neighbor. Instead, U.S. producers are finding replacement markets in Germany, South Africa and Japan. 
    5 News Stories To Understand This Moment in Global Trade 📰
      
    WSJ: A Shrimper, a Carmaker, a Lawyer: How the World Tackled Trump’s Trade War: A fascinating mini-survey of how businesses around the world are being impacted by tariffs.Euronews: In 2025, global trade cracked as Europe hurt by US tariffs and new China shock: An important perspective, from Europe, on how trade flows have been rerouted toward the Old World. Global Trade: U.S. Tariffs to Cost Container Carriers $.2 billion by 2026, Alphaliner Warns: The U.S. isn’t just imposing tariffs on goods, it’s putting duties on ships. AP: Trump launched global tariff wars in 2025. Here’s a recap of his trade actions this year: A useful recap of U.S. trade duties in 2025. BBC: Peru’s ‘fast and furious’ blueberry boom: An optimistic story about global trade, chronicling how Peru has become the world’s biggest blueberry exporter.
    What We’re Reading 📚
      With tariffs still beating down optimism over global trade, it’s easy to get dragged down by the political story of modern commerce. What’s lost is the triumph of human ingenuity represented by the global logistics industry figuring out how to move goods from any place in the world to any other place. My former Wall Street Journalcolleague Christopher Mims tells that story in his 2021 book Arriving Today: From Factory to Front Door—Why Everything Has Changed About How and What We Buy. In an illustrative anecdote, Mims tells the story of a USB charger. After leaving a factory in Vietnam, Mims recounts, the charger “has traveled more than 14,000 miles, across 12 times zones, by truck, barge, crane, container ship, crane, and truck again, all before it trundled down a few hundred yards of conveyor, flitted about on the back of a robot, and was ferried again on, all told, miles more conveyor and at least two more trucks, before being hand-carried to someone’s front door.”
  • Chinese Exports Down 1.1% in October

    Chinese Exports Down 1.1% in October

    The Chinese export juggernaut finally started to show the impact of protectionism and weaker Western consumer markets in October. 

    A week after Presidents Trump and Xi settled a new trade deal that cut tariffs and put off their trade war for a year, China reported a 1.1% year-on-year drop in exports to $305.3 billion. 

    To be sure, this is only one month. China has shown resiliency thus far in 2025, finding other markets as Washington puts up obstacles to its exports. Shipments to the U.S. have declining since the spring. In October, exports to the U.S. fell 25.1% year-on-year to $34.9 billion. But sale to the European Union, especially Germany and France, had been holding steady. In October, surprisingly, they rose only 1%, to $43.9 billion.

    Analysts had predicted a 3% overall increase in exports, meaning that China missed its target by 4 percentage points. 

    Much of the recent analysis has focused on protectionist trade policies driven by populist politics. Although they have caused headaches for businesses by creating a climate of uncertainty, real tariffs have been lower than headline duties. Instead, a big part of the leveling off of Chinese exports has been caused by a change in its export composition, and in consumer demand in the U.S. and Europe. That’s why there’s been dramatic drops in shipments of consumer goods where China used to dominate. In October, for example, toy exports fell a whopping 31% to $2.5 billion. Shoe sales dropped 20.9% to $2.7 billion. Suitcase exports declined 25.7% to $2.1 billion. It’s not just the low-tech stuff. The number of mobile phones shipped dropped 14.2% to 70.6 million. Exports of high-tech products increased a modest 1.8% to $83 billion. 

    Meanwhile, China is dominating new markets, especially in the automotive sector. Car shipments boomed again in October, rising 34.1% year-on-year to $14.3 billion. In Europe and the U.S., China still has to contend with strong domestic manufacturers. These exports tend to go elsewhere. China’s top 10 car markets so far this year: UAE, Russia, Belgium, UK, Mexico, Australia, Brazil, Saudi Arabia, Spain, Kazakhstan.  

    The bright spots: In October, shipments to ASEAN nations rose 11.1% to $53.3 billon; exports to Vietnam increased 22.4% to $16.6 billion. Exports to Africa rose 9.4% to $17.7 billion. Exports to Latin America increased 2.2% to $24.1 billion. Exports to Russia, however, plummeted 22.5% to $8.5 billion. 

    The slowdown in trade poses a challenge for Chinese policymakers. “As exports rapidly lose steam and retail sales show signs of deterioration, we see increasing pressure on Beijing to step up policy support to stabilize growth” until the end of 2025, Nomura wrote in a note.

    Domestically, there are certainly questions. 

    In October, imports rose only 1% to $215.3 billion, raising questions about domestic demand. Imports of agricultural products rose 7.1% to $17.2 billion. Purchases of high-tech products rose by 3.1% to $69.9 billion. 

    Imports from the U.S. declined 22.5% to $10.2 billion. Imports from the EU rose 4% to $22.1 billion. Imports from ASEAN countries fell 4.6% to $32.5 billion. Purchases from Africa increased 5.4% to $9.7 billion. Imports from Latin America, goosed by soybean sales, were up 15.1% to $21.5 billion. Imports from Russia rose 0.9% to $11 billion. 

    Beijing has reported GDP growth of 5.2% over the first nine months of the year, and seems on track to hit the government’s 5% goal for the year. 

    One good sign is the country’s appetite for industrial commodities: Imports of copper and iron ore rose year-on-year in October, as did purchases of natural gas and crude oil. Imports of coal continued to fall sharply.

  • Trump Election Gooses Trade– Before Tariffs Hit

    Trump Election Gooses Trade– Before Tariffs Hit

    This week’s election of Donald Trump as the U.S.’s 47th president is almost certainly likely to lead to another trade war with China, and further tariffs on American imports. During the campaign, Trump said his favorite word was tariff and floated a universal 10% tariff and specific duties on Chinese imports as high as 60%.

    If applied, the levies would jack up average tariffs to 17.7%, America’s highest rate since 1934, during the Great Depression, according to the Tax Foundation, representing a sharp turn toward deglobalization, and a potential deflation of China’s powerful export economy. 

    The affirmation of Trump’s election this week will accelerate a trend international manufacturers and purchasers worried about the risk of tariffs have already set in motion—increased exports, especially from China to the U.S. and Europe, before the tariffs hit sometime during the course of next year.

    In October, China increased its overall outbound shipments a whopping 12.7% year-on-year to $309.1 billion, their briskest pace in more than two years. At the same time, imports declined 2.3% to $213.3 billion. The lackluster import figures point to potential weaknesses China’s domestic economy.

    That makes taking advantage of current trade terms with the U.S., China’s number one export market, even more urgent. Exports to the U.S. increased 8.1% in October to $46.7 billion. Interestingly, imports from the U.S. grew 6.6% to $13.2 billion, making it one of the only regions to increase exports to China in October. Beijing is almost certain to retaliate next year with tariffs on U.S. imports, kicking off a new, heightened trade war. “Trump’s return could create a short-term boost to Chinese exports as U.S. importers increase their purchases to get ahead of tariffs,” wrote Zichun Huang of Capital Economics in a research note.

    The U.S., of course, is not the only economic power ramping up protectionism. This year, the European Union and Canada also imposed tariffs on imports of Chinese electric vehicles. Officials in those jurisdictions are expected to further hike duties, heightening the urgency of making shipments. Exports to the European Union rose 12.6% to $43.5 billion, while imports from the EU fell 6.1% to $21.3 billion. Overall, China exports around a trillion dollars of goods annually, roughly 30% of its overall exports, to the U.S. and Europe. 

    In October, Chinese exports rose across the board for all kinds of goods. Shipments of agricultural products rose 11% to $9.2 billion. Sales of high-tech products increased 9.3% to $81.6 billion. Exports of toys rose 4.1% to $3.7 billion. Exports of motor vehicles grew 4% to $10.7 billion. A couple exceptions: shipments of mobile phones declined 0.4% to $18.6 billion, and sales of footwear fell 1.1% to $3.4 billion.

    With trading partner after trading partner, China ramped up its trade surplus. Exports to ASEAN nations, which are part of a new Asian supply chain network, increased 16.2% to $48 billion, while imports fell 7% to $34 billion. Exports to Africa increased 21.1% to $16 billion, while imports shrank 8.2% to $9.2 billion. Exports to Russia increased 26.7% to $11 billon, part of an integration of the two massive economies since Russia invaded Ukraine. Imports, however, fell 3.9% to $10.8 billion. Exports to Latin America increased 23.1% to $23.6 billion, while imports fell 10.4% to $18.6 billion

    Imports of ag products fell 4.9% to $16 billion. Shipments to China of high-tech products rose 9.1% to $67.9 billion. Imports of natural gas rose 27.1% to $5.4 billion. Imports of coal rose 14.4% to $4.1 billion. 

    This week, Beijing is set to announce a new package of stimulus measures. One sign it might need it: It is the world’s number one energy importer, and in October Imports of oil dropped 25.3% year-on-year to $24.3 billion by value and 8.7% by quantity to 44.7 million tons.

    John W. Miller